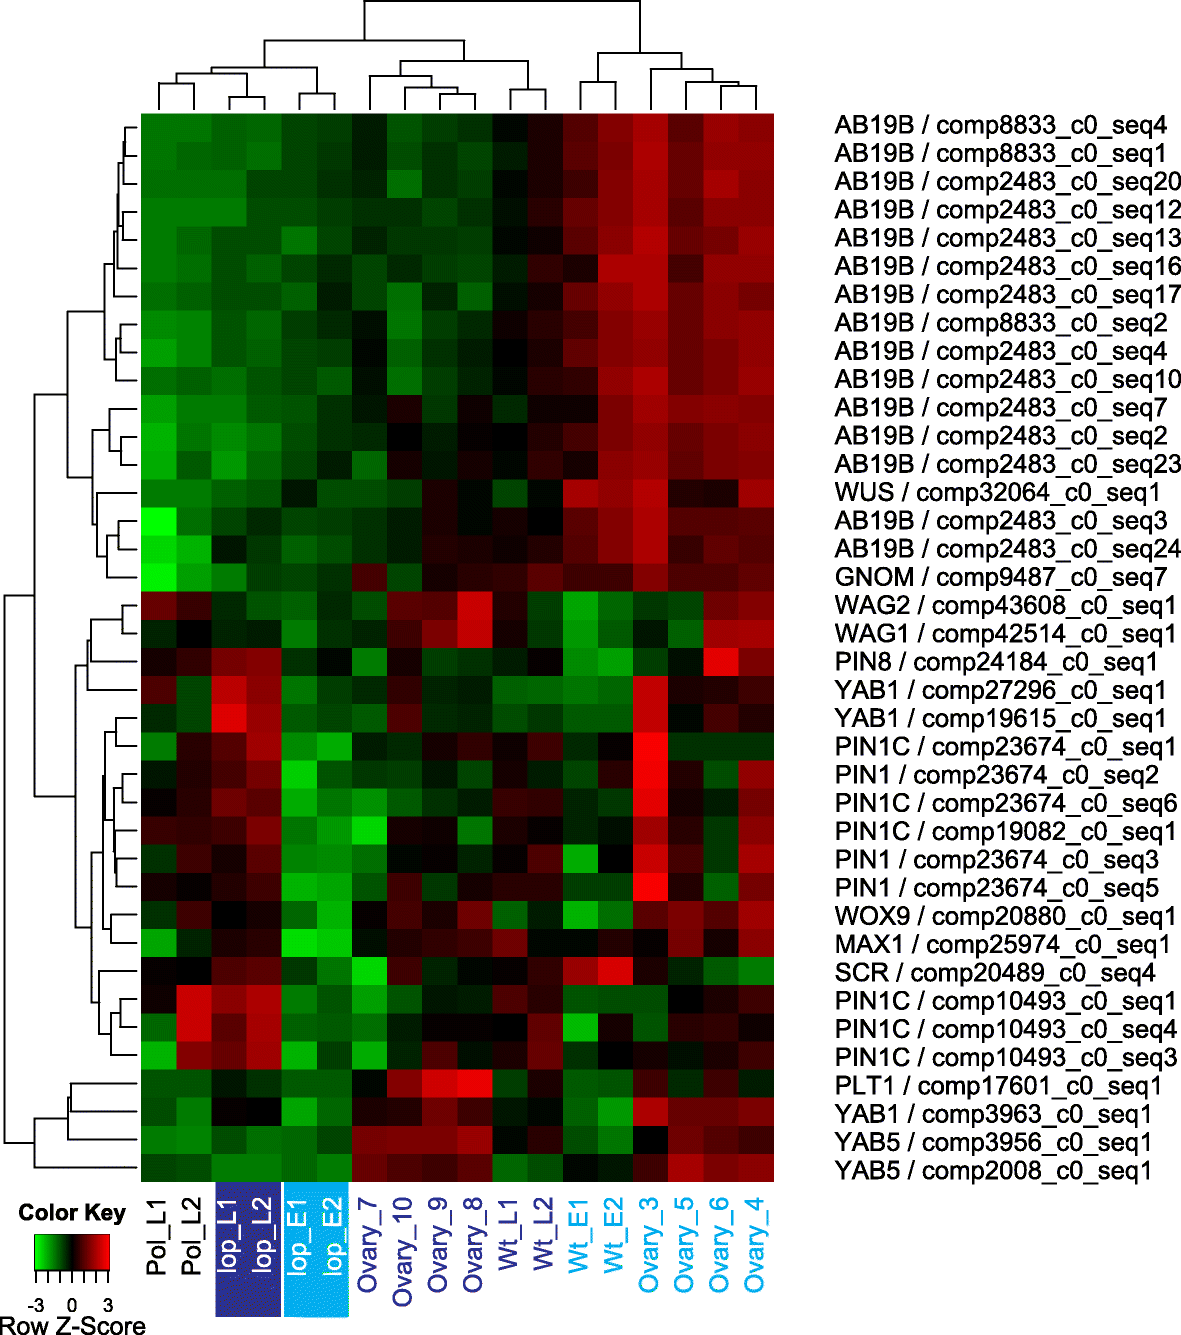
Fig. 5

Expression patterns of DE transcripts associated with auxin transport and embryo development. Hierarchically clustered expression heatmap with rows represent each transcript (labeled by the putative protein and the transcript ID) and relative expression (low in green and high in red) in the samples as indicated. Pre-embryo stages are indicated in light blue and post-embryo stages in dark blue text; thelopmutant pre-pollination (lopE1, E2) and post pollination (lopL1 and L2) are also highlighted)
