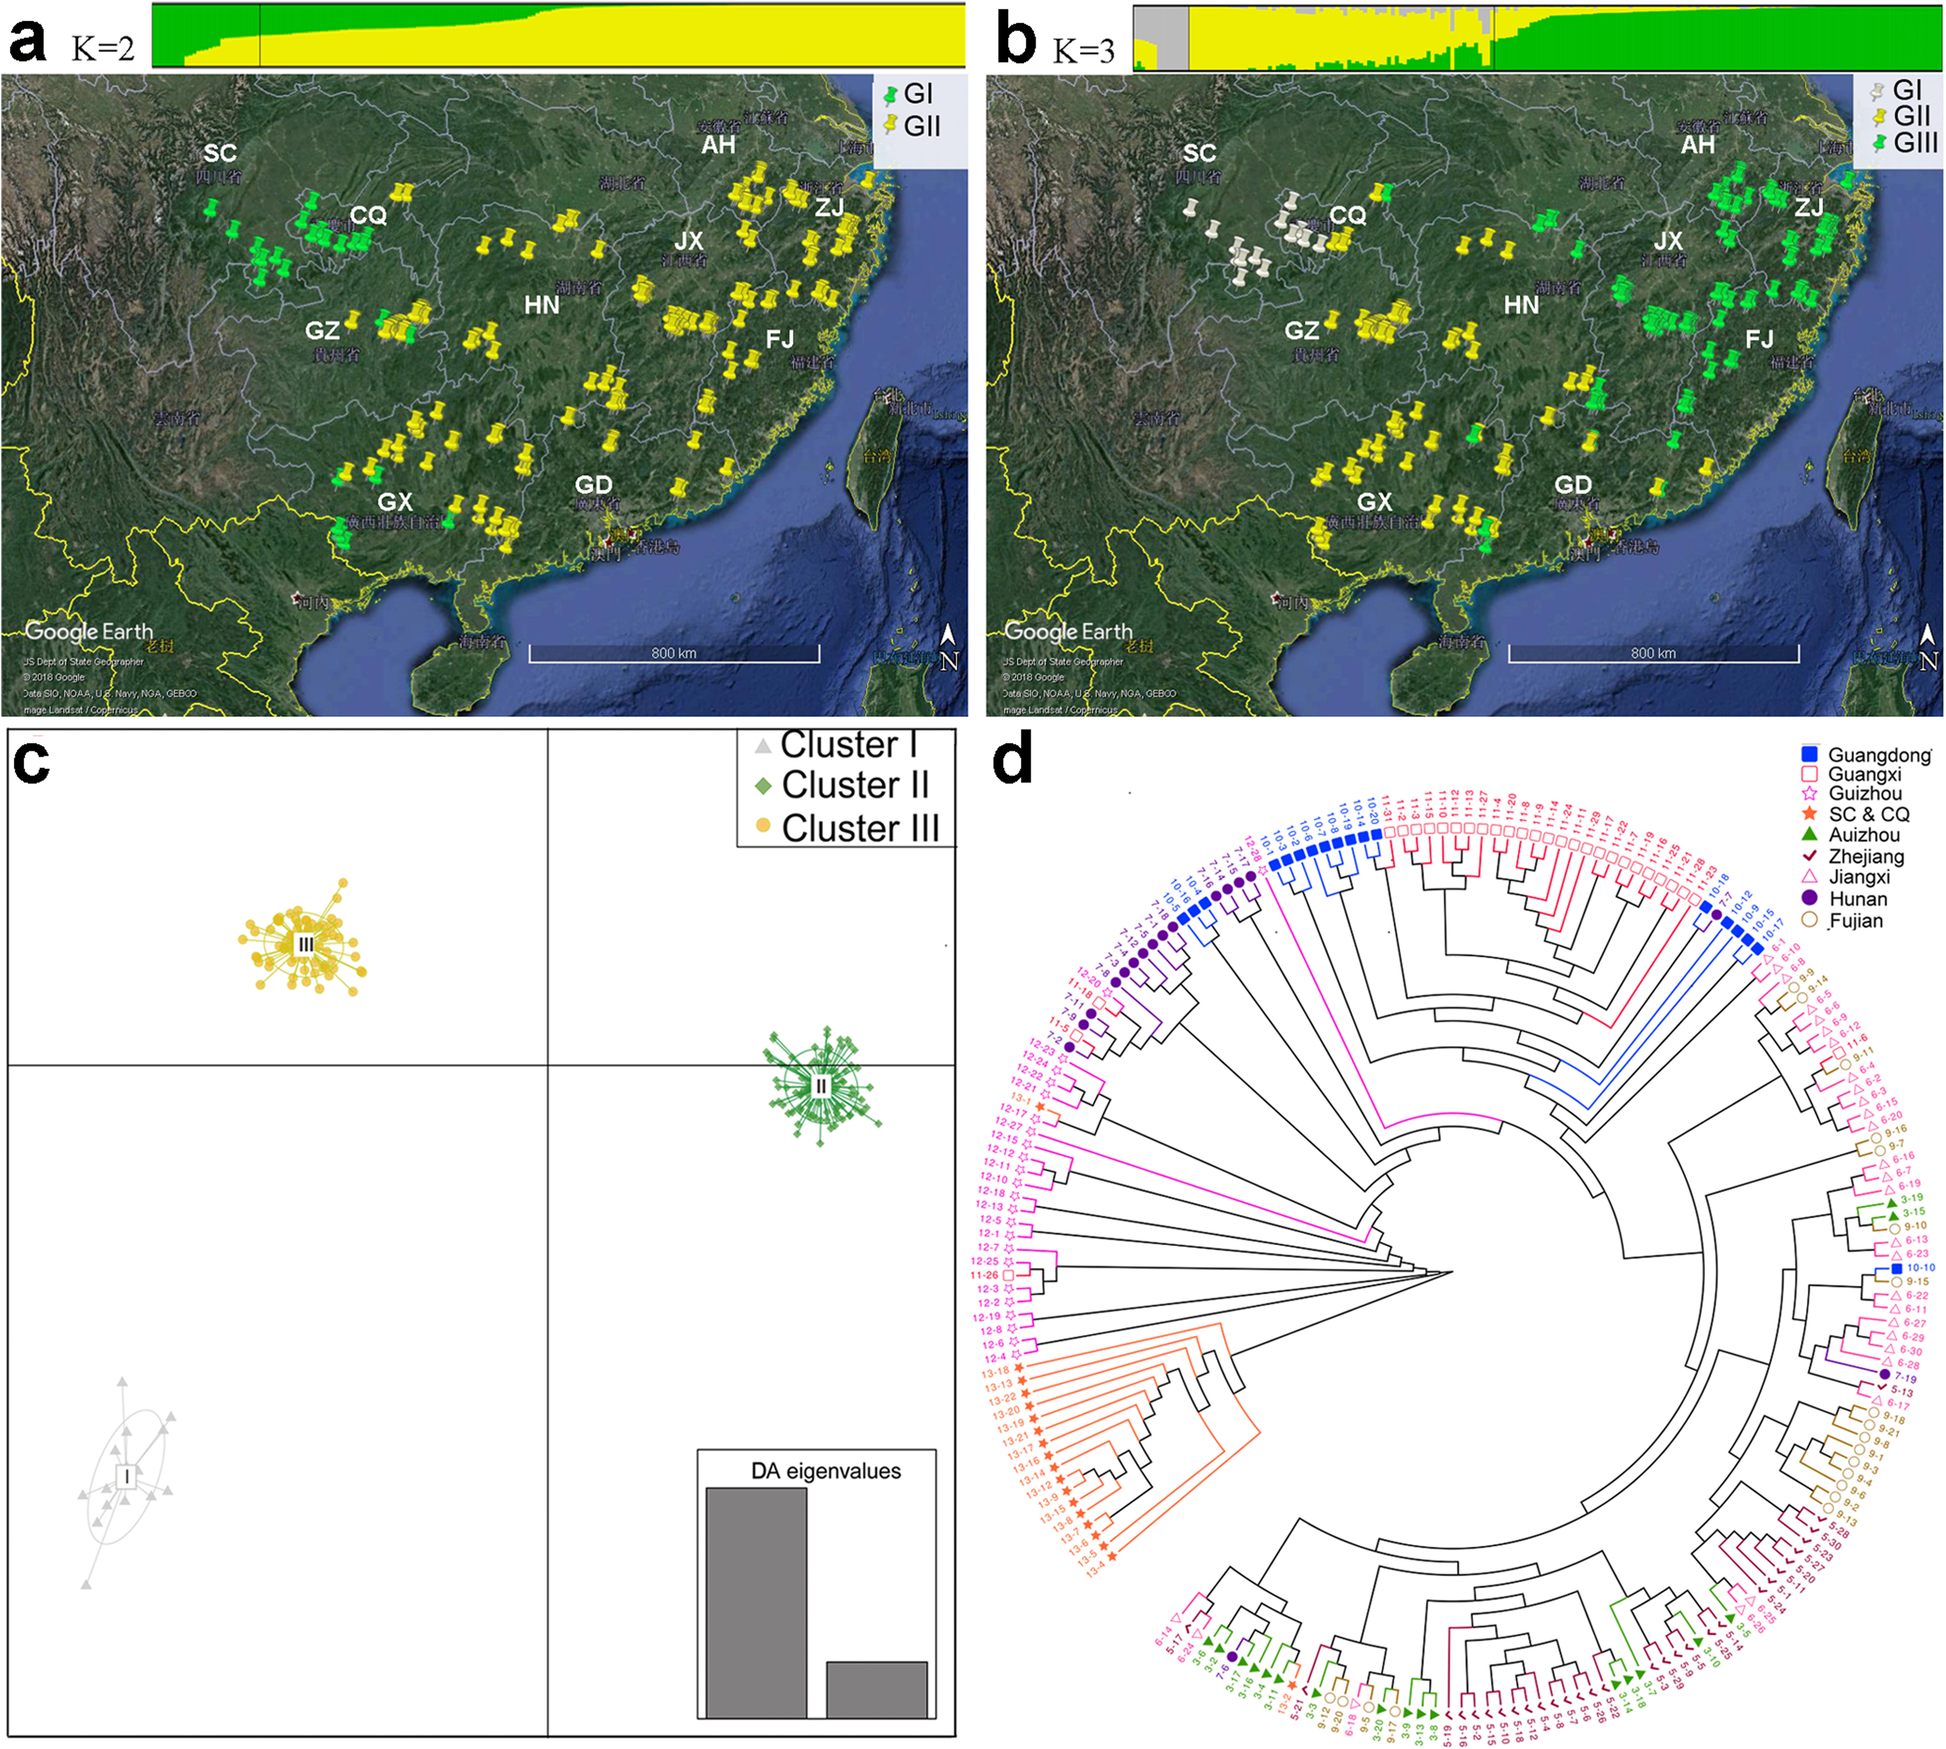
Fig. 2

Characterization of the masson pine population.aandbPopulation structure and the corresponding groups of 204 masson pines. GI, Group I; GII, Group II; GIII, Group III. The image was created in Google Earth.cTwo-dimensional discriminant analysis of principal component (DAPC) scatter plot. All genotypes were grouped in three clusters. Cluster I: Sichuan and Chongqing; Cluster II: Jiangxi, Fujian, Zhejiang, and Anhui; Cluster III: Guizhou, Guangxi, Guangdong, and Hunan.dPhylogenetic tree of the 204 masson pines based on the 94,194 SNPs. SC&CQ, Sichuan and Chongqing
