Fig. 2
From:Ecological genomics of Chinese wheat improvement: implications in breeding for adaptation

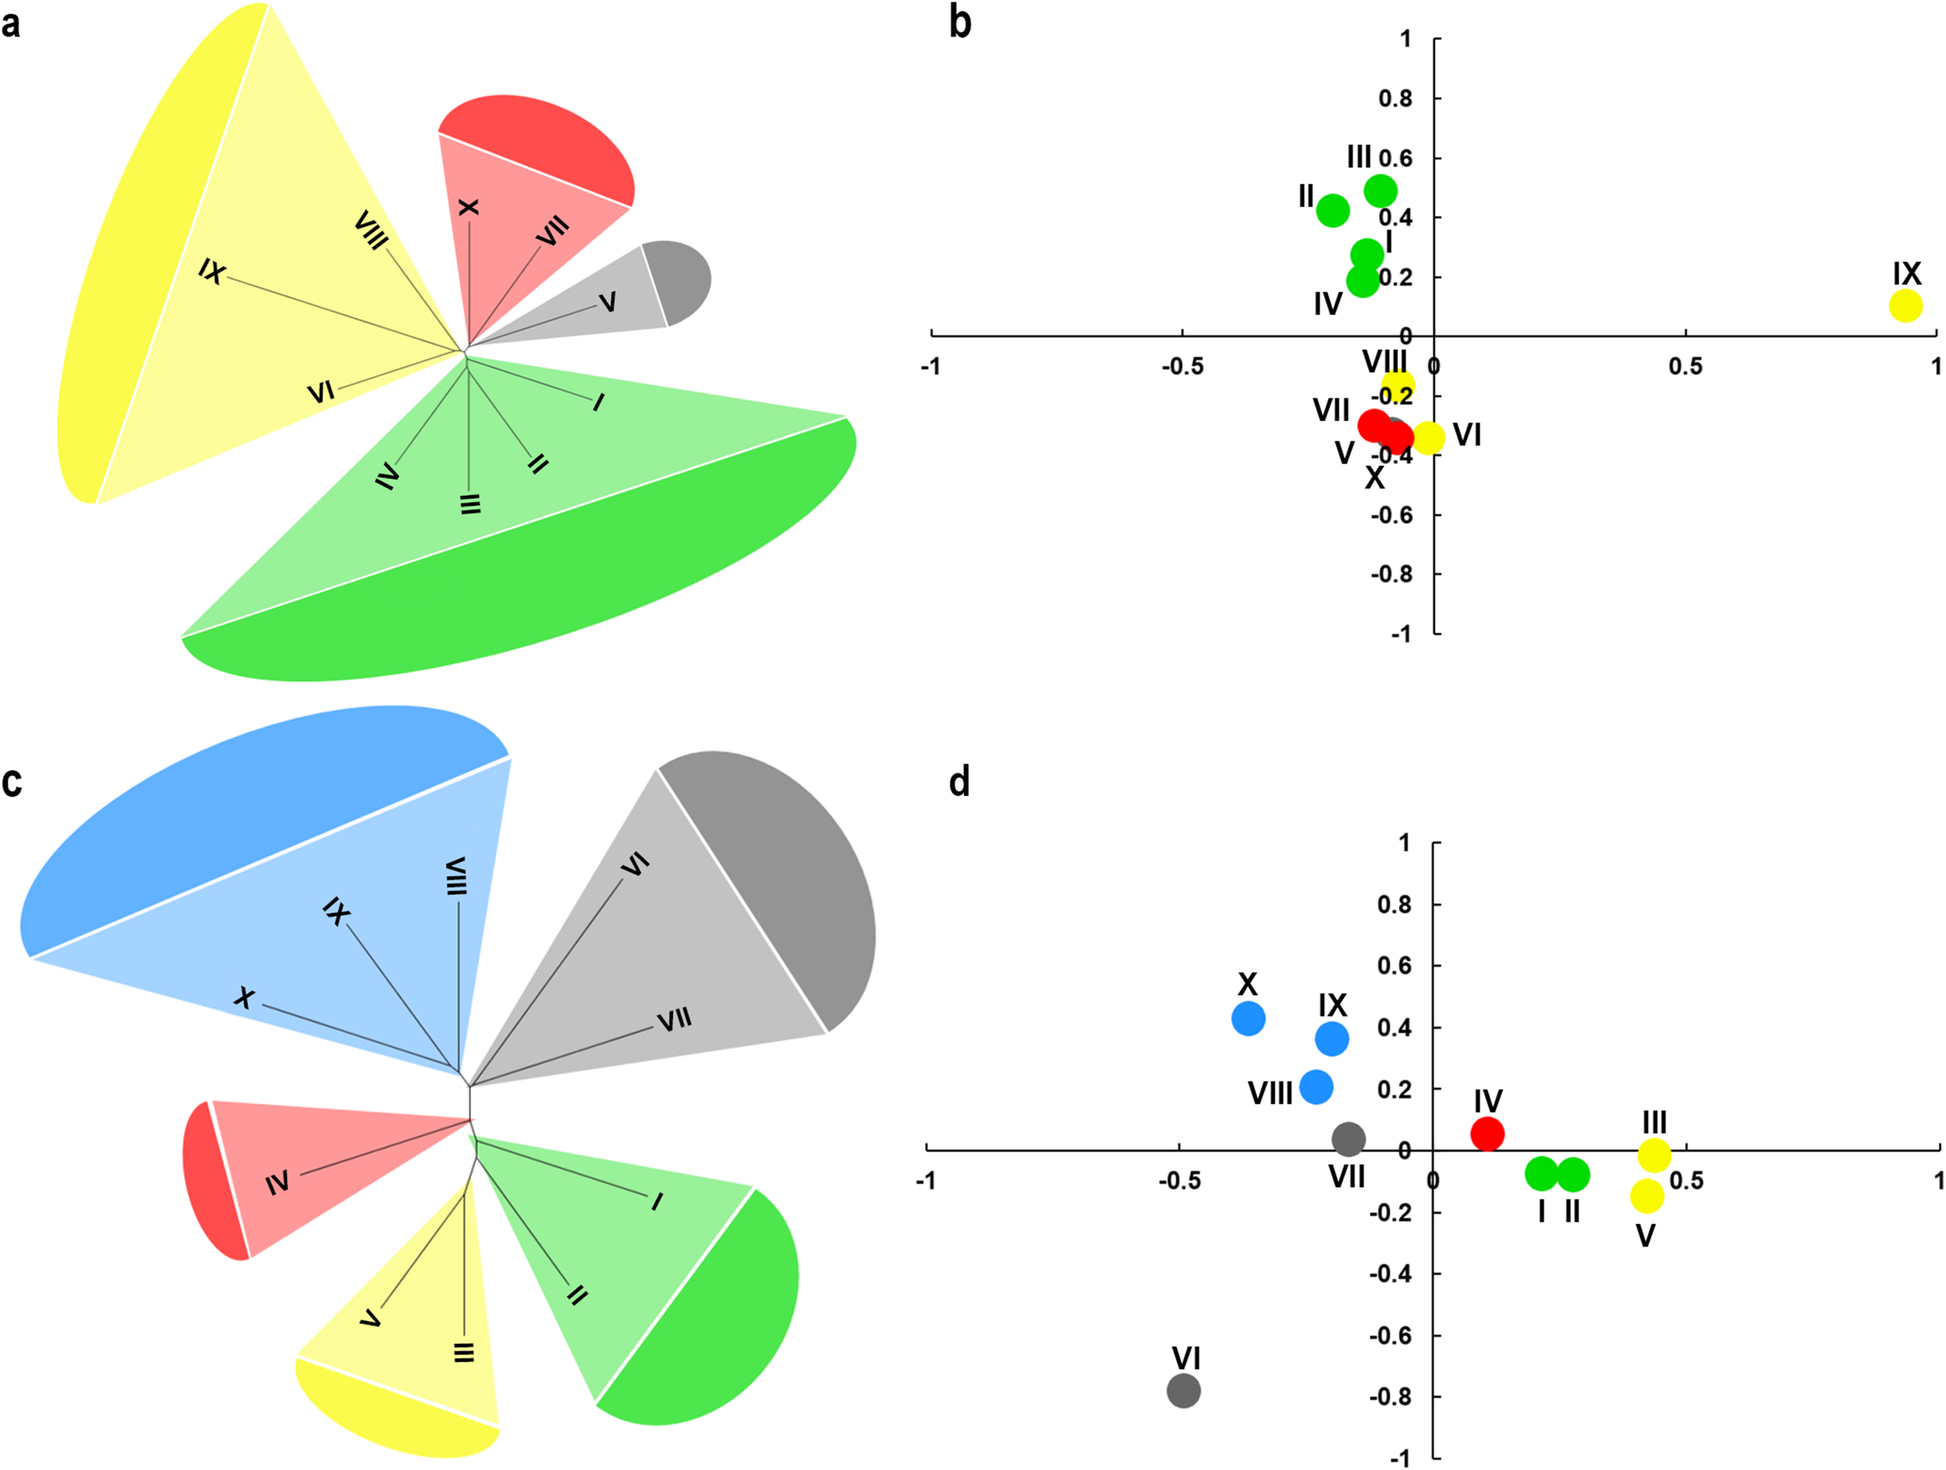
Population structure analysis of ten wheat agro-ecological zones with 52 KASP markers.a, Phylogenetic tree of ten wheat agro-ecological zones in Chinese landraces (CL), I to X represents each zone.b, PCA plot of ten wheat agro-ecological zones in CL, the solid dot means each zone, and the color of dots are the same with that in Fig.2a.c, Phylogenetic tree of ten wheat agro-ecological zones in modern Chinese cultivars (MCC), I to XI represents each zone.d, PCA plot of ten wheat agro-ecological zones in MCC, the solid dot means each zone, and the color of dots are the same with that in Fig.2c
