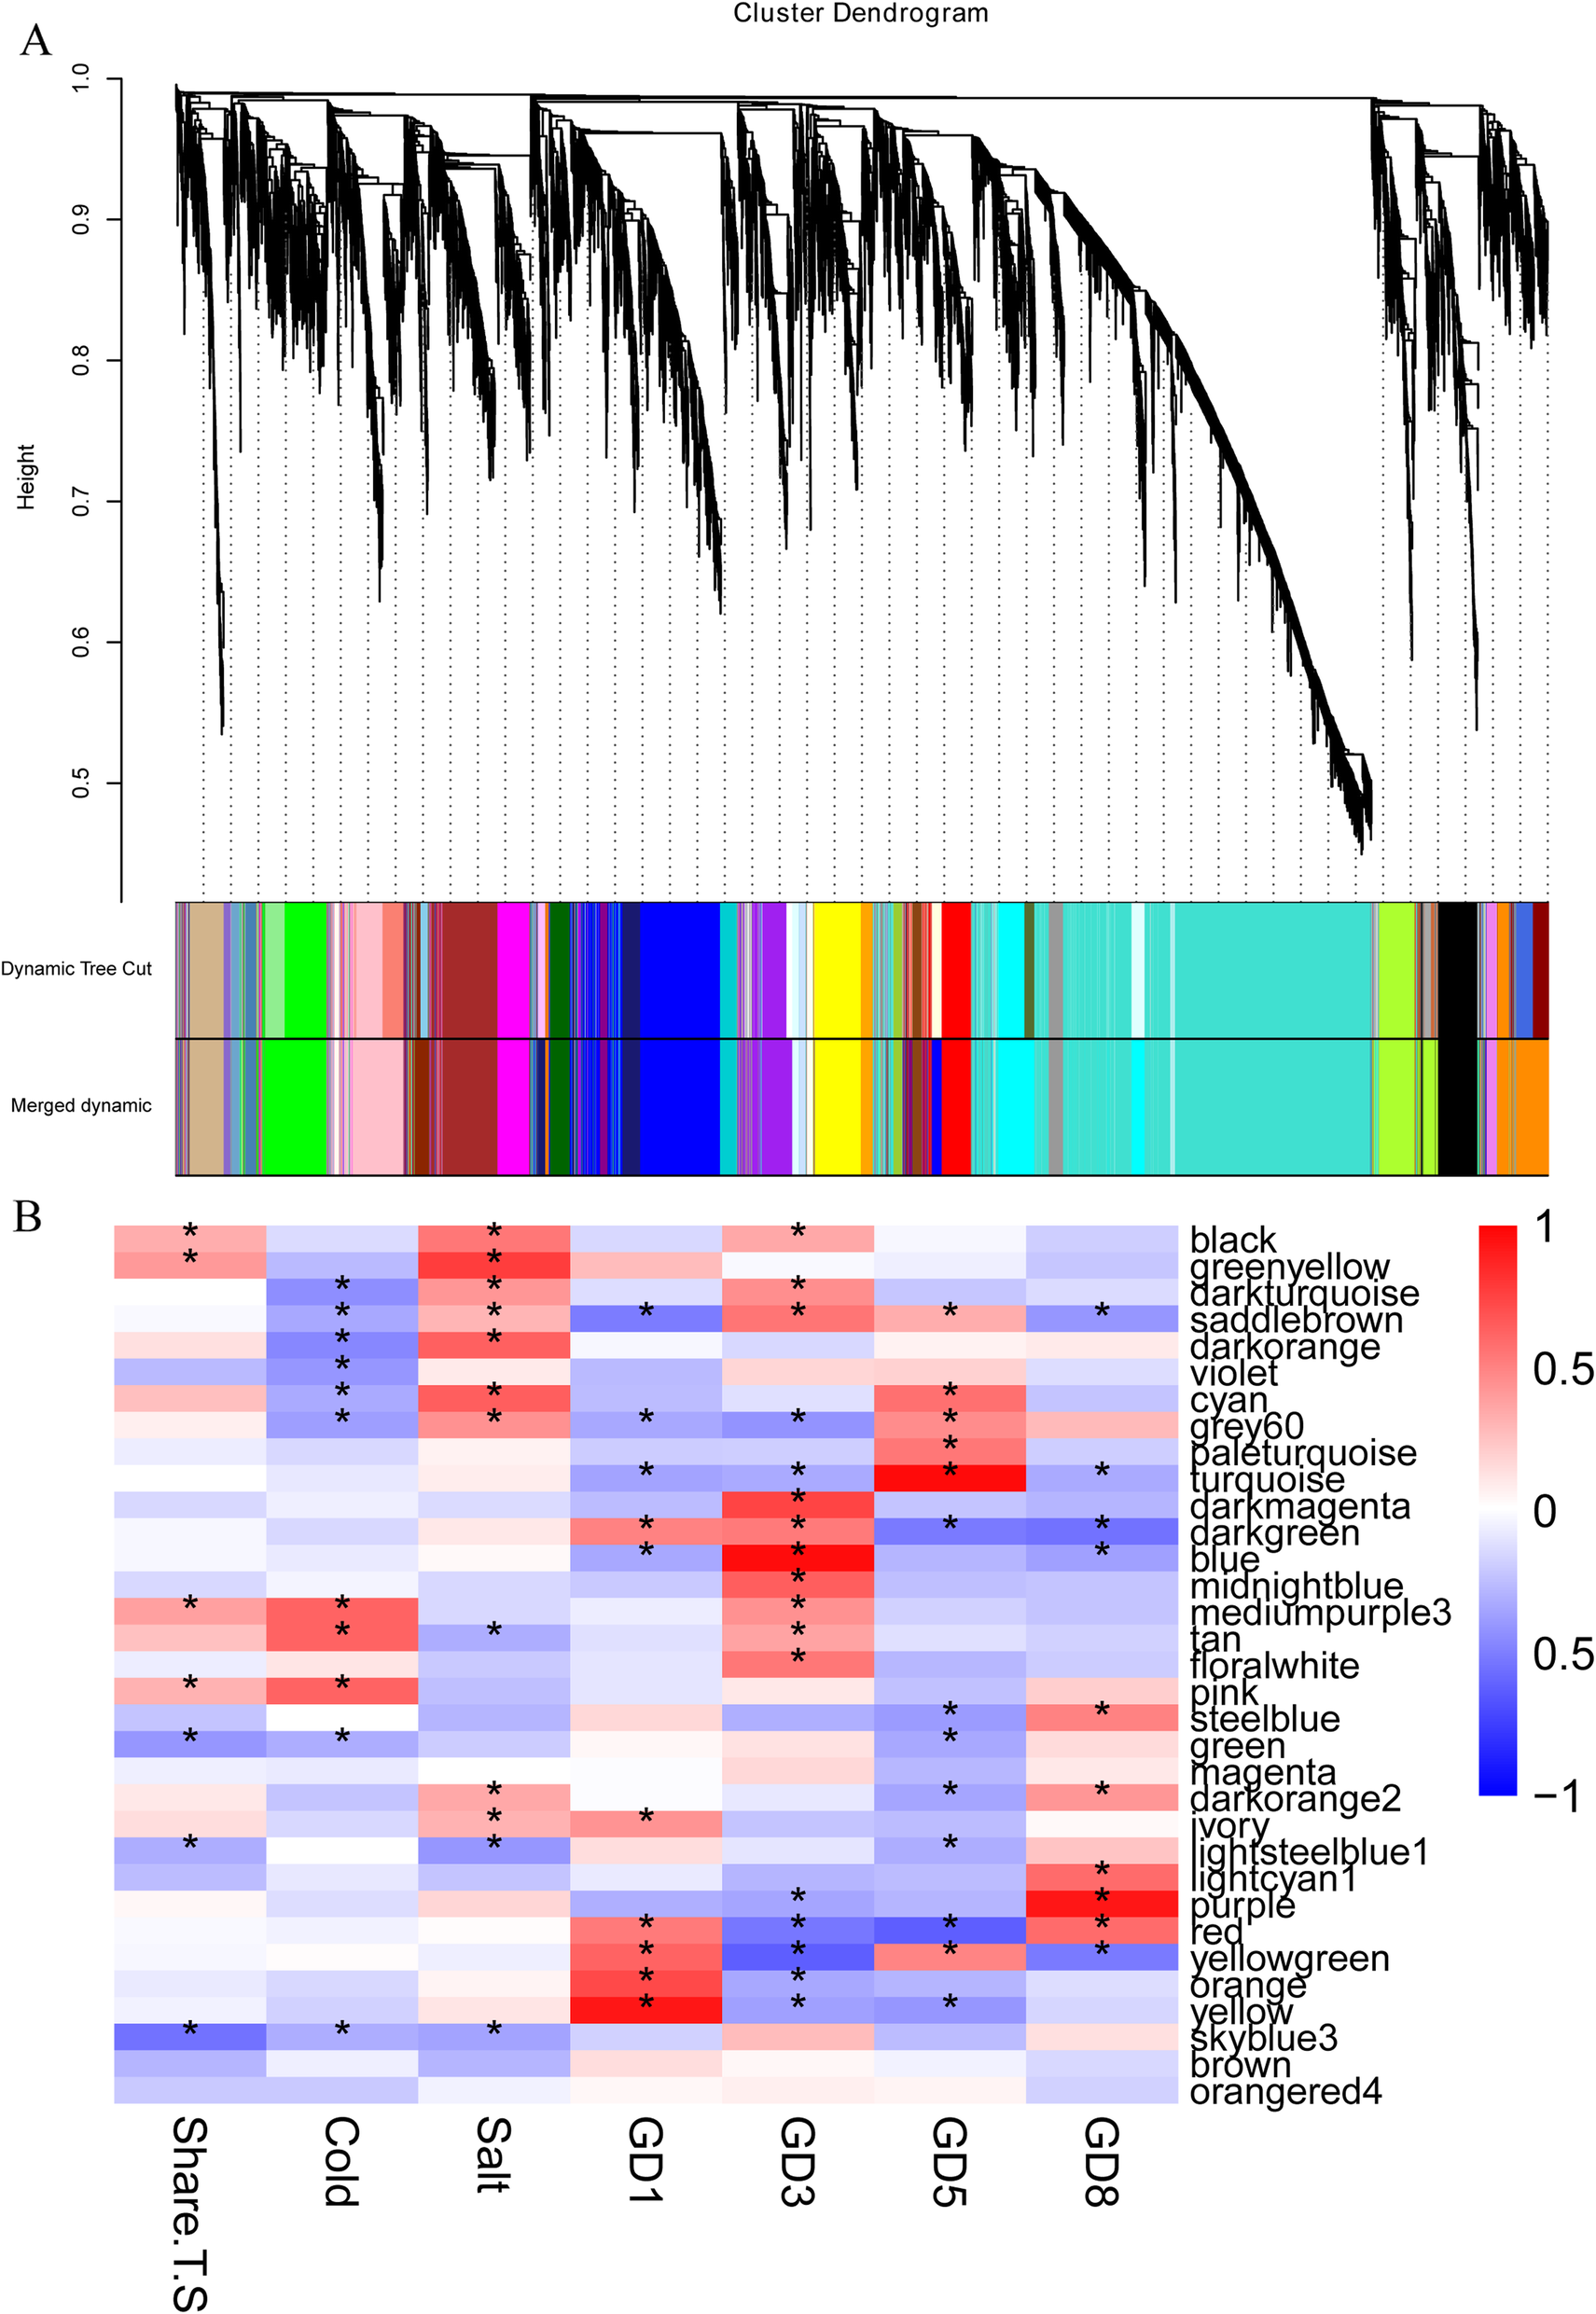
Fig. 4

Co-expression network analyses by WGCNA.aHierarchical cluster tree showing co-expression modules identified by WGCNA. Each leaf in the tree represents one gene. The major tree branches constitute 33 modules labeled with different colors.bModule–sample association. Each row corresponds to a module labeled with color as in (A) Modules are distinguished by different colors which were arbitrarily assigned by the WGCNA package. Each column corresponds to a tissue type as indicated. The color of each cell at the row-column intersection indicates the correlation coefficient (R) between the module and the tissue type. *Significance atP < 0.05; **Significance atP < 0.01
