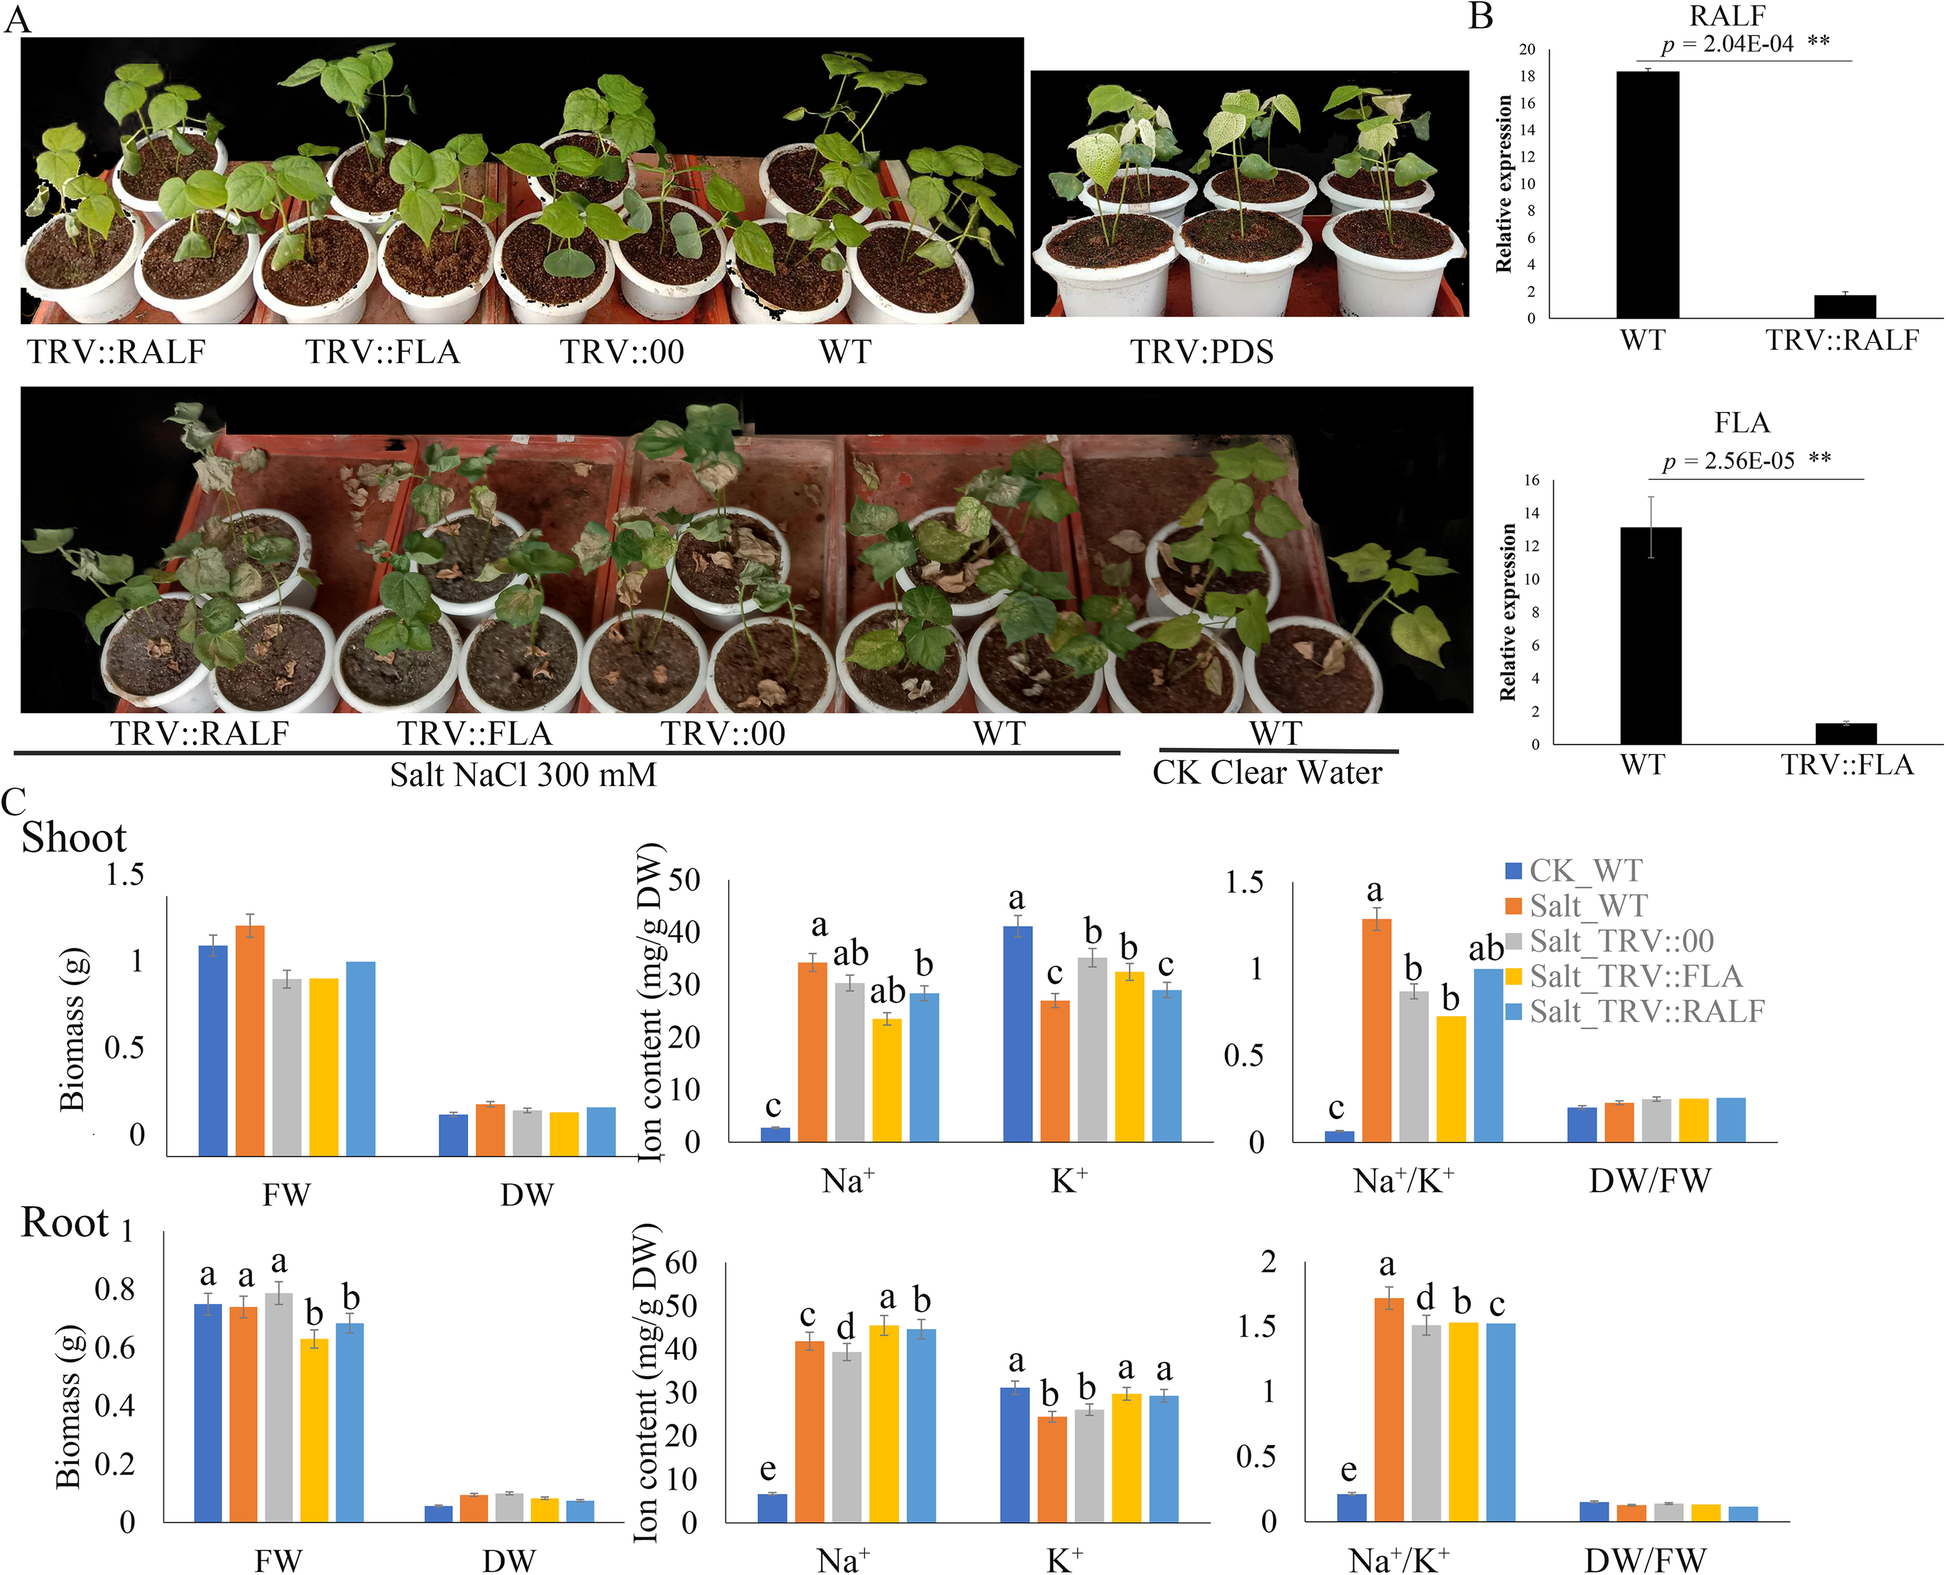
Fig. 7

Phenotype observed in the silenced plants with the TRV: 00 empty vectors, wild type plants, and the silenced plants at 12 days post-inoculation.aAlbino’s appearance on the leaves of the PDS infused plants.bRT-qPCR analysis of the change in the expression level of theRALFandFLAgenes in cotton plants treated with VIGS.cEvaluation of fresh shoot biomass, fresh root biomass, Na+,and K+ions concentration and their ratios. Letters a/b indicate statistically significant differences (two-tailed,p < 0.05). The error bars of theRALF andFLAgene expression level represent the standard deviation of three biological replicates
