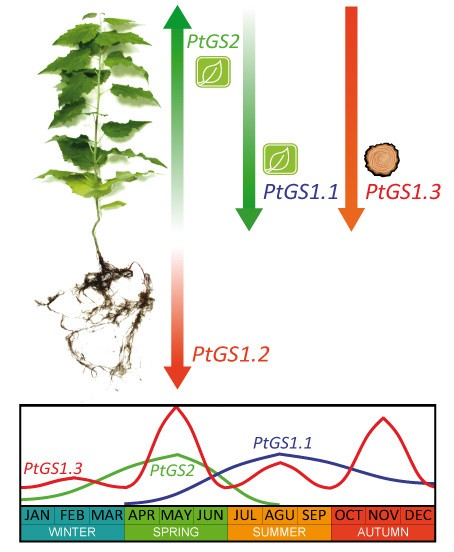
Figure 8

Schematic representation of the spatial and seasonal regulation of the poplarGSfamily. The arrows and intensity of colors indicate the existence of a gradient of gene expression along the plant axis. Maximum values of gene expression in leaves, stems and roots were considered in the scheme. Global seasonal variation reflects major changes in gene expression.
