- Research article
- Open Access
- Published:
The pattern ofPhosphate transporter 1genes evolutionary divergence inGlycine maxL.
BMC Plant Biologyvolume13, Article number:48(2013)
Abstract
Background
ThePhosphate transporter 1(PHT1) gene family has crucial roles in phosphate uptake, translocation, remobilization, and optimization of metabolic processes using of Pi. Gene duplications expand the size of gene families, and subfunctionalization of paralog gene pairs is a predominant tendency after gene duplications. To date, experimental evidence for the evolutionary relationships among different paralog gene pairs of a given gene family in soybean is limited.
Results
All potentialPhosphate transporter 1genes inGlycine maxL. (GmPHT1) were systematically analyzed using both bioinformatics and experimentation. The soybeanPHT1genes originated from four distinct ancestors prior to the Gamma WGT and formed 7 paralog gene pairs and a singleton gene. Six of the paralog gene pairs underwent subfunctionalization, and whileGmPHT1;4paralog gene experienced pseudogenization. Examination of long-term evolutionary changes, sixGmPHT1paralog gene pairs diverged at multiple levels, in aspects of spatio-temporal expression patterns and/or quanta, phosphates affinity properties, subcellular localization, and responses to phosphorus stress.
Conclusions
These characterized divergences occurred in tissue- and/or development-specific modes, or conditional modes. Moreover, they have synergistically shaped the evolutionary rate ofGmPHT1family, as well as maintained phosphorus homeostasis at cells and in the whole plant.
Background
To adapt to challenging environments, plants have developed dramatic modifications in morphological, physiological, biochemical and molecular processes. Gene duplications are widespread in plant genomes, having accumulated a wealth of genetic raw materials to meet the selection pressures of new environmental conditions [1–5].After gene duplications, there are several possible fates for duplicated genes (or paralogs), which include subfunctionalization through purifying selections (Ka/Ks < 1) [6], neofunctionalization through positive selections (Ka/Ks > 1) [7], pseudogenization [8], and loss in genome (fractionation) [9–11].Subfunctionalization is the predominant paralog outcome following duplications [12].It reduces the fitness cost of gene duplication by buffering dosage imbalances, as well as maintaining the functional requirements of the ancestral locus [13].
In plants, phosphorus is one of three primary mineral nutrients. It is second most limiting macronutrient for optimal growth, due to the relatively large amounts of Pi required by plants, the limited amount of available phosphorus (orthophosphate, Pi), and the poor mobility of phosphorus in soil [14,15].Plant uptake of Pi from soil relies heavily upon the phosphate transporter 1 family (PHT1) [16].PHT1等离子体膜蛋白基因代码,反对tain 12 transmembrane domains. The PHT1 proteins are functionally involved in Pi uptake from the soil, Pi translocation across plant tissues, and Pi remobilization from senescent organs (Review in [14,17,18]). Homologous genes ofPHT1have been identified in a wide range of species, and they share conserved functions in the Pi uptake (Additional file1) [14] and variable Pi affinity [19–22].
The soybean has experienced the Gamma whole genome triplication (Gamma WGT) ~130 to 240 million years ago (mya), the legume WGD (Legume WGD, ~58 mya), and theGlycineWGD in theGlycinelineage (GlycineWGD, ~13 mya) [23,24].As a result, in the present soybean genome, about 75% of the genes have multiple paralogs [23,25].大约50%的这些假字是不同的entially expressed and underwent subfunctionalization [12], possibly contributing to phenotypic variation in polyploids [3].
ManyPHT1genes have functionally identified in many plants, but they are studied as an individual. This was a limiting step for both further functional characterization of PHT1 family as a whole and genetic evolution analysis of them in relation to low Pi environment adaptations. In this study, 15GmPHT1(GlycinemaxPHT1) family paralogs from soybean were identified. Based on data from spatio-temporal expression profiles, functional characterizations in a heterologous yeast system and subcellular localizations, we propose fates of paralogs of soybeanPHT1were subfunctionalization. These results provided a strong basis for function analysis and evolution of gene families.
Results
Identification, phylogenetic relationship and promoters of soybeanPHT1genes
Fourteen soybeanPHT1genes with full length sequence were found [26,27].In addition, a syntenic analysis using the PGDD or CoGe databases identified one potential pseudogene (Glyma13g18420), which had a truncated open reading frame length (ORF) of 444 bp. This potential pseudogene, which was determined to be masked, has not been previously identified [21,26,28].For an unified nomenclature for the soybeanPHT1s (Additional file2), fifteen soybeanPHT1genes were renamed asGLYma;Pht1;1throughGLYma;Pht1;15according to the Commission for Plant Gene Nomenclature, and abbreviated asGmPHT1;1through15in the following content.
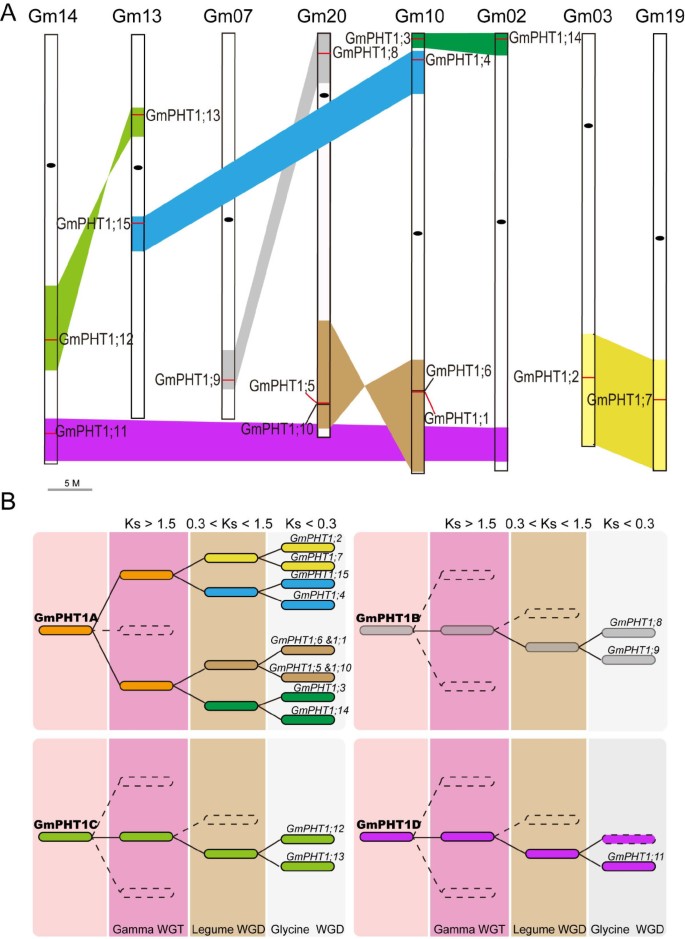
These 15PHT1genes are dispersed across eight chromosomes and form 7 paralog gene pairs and one singleton (Figure1A). These paralog gene pairs shared 93.5 ~ 97.1% in sequence (Additional file3A) and similar gene structures (Additional file3B). For example, bothGmPHT1;8andGmPHT1;9have 3 exons, bothGmPHT1;3andGmPHT1;14are composed of 2 exons, while the others only contain one. However, an extra intron in 5′-UTRs ofGmPHT1;1,GmPHT1;4andGmPHT1;5was identified (Additional file3B).
The evolution of theGmPHT1gene family. A, Syntenic relationships among homologous blocks carrying the 15GmPHT1sequences after theGlycineWGD event. Similar colored blocks imply homology, the short red lines within these blocks show the location ofGmPHT1s, and the black oval is the centromere.GmPHT1;15is the pseudogene and the paralog gene ofGmPHT1;11was lost.B, The evolutionary model forGmPHT1-containing genomic blocks in the process of the soybean genome evolution, indicatingGmPHT1s originated from four independent ancestors. Different backgrounds depict different whole genome duplication events. The colored blocks imply homology based on the averageKsvalues. The paralog gene ofGmPHT1;11was lost in the dotted block dotted, although other genes are collinear with the block containingGmPHT1;11. The detailed collinearity relationships are shown in Additional file5C.
To identify the phylogenetic relationship of the soybeanPHT1genes with full length sequence, a neighbor-joining tree was reconstructed based on the multiple sequence alignment (Additional file4). The PHT1 family was monophyletic [29] and can be grouped into four subfamilies in the angiosperm: the subfamily I is composed ofPHT1genes induced by arbuscular mycorrhizal fungi (AMF), subfamily II genes are from both mono- and dicotyledonous species, subfamily III are exclusively from dicotyledonous species, and subfamily IV are exclusively from monocotyledonous species [26,30].此外,亚二世是密切遗传代数ed to the homologs from the fungi by high bootstrap value (Additional file4), indicating it was present before the occurrence of terrestrial plant and an older evolutionary lineage. In the soybean, fourteen PHT1 genes were clustered into three subfamilies: subfamily I, subfamily II and subfamily III (Additional file4) [21,26].
The paralog gene pair’s promoter region sequence similarities are lower than their CDS sequences (Additional file3A). Many similarcis-acting regulatory DNA elements, which are relative to the nodulin, root, flower, leaf, seed, abiotic or biotic stress, sugar and hormone (Additional file5A), can be found in promoter regions of 14PHT1genes according to the PLACE results [31].For example, thecis-elements relative to the root-specific (ROOTMOTIFTAPOX1) and nodule-specific (NODCON1GM and NODCON2GM) are present in 14 soybeanPHT1promoters (Additional file5A). ExceptGmPHT1;9promoter, other soybeanPHT1promoters contain phosphate starvation responsivecis-element (PIBS). AndGmPHT1;9promoter did not embody PIBS motif but a variant PIBS motif (76% similarity to PIBS) (Additional file5A). The differences in commoncis-elements across these promoter regions include both their number and their distance from the starting code (Additional file5A). That indicated the number ofcis-elements and their distance from the transcription start sites affected response abilities of PHT1 to the environment.
Soybean PHT1 genes originated from four ancestors prior to the Gamma WGT event
The average synonymous substitution rate (Ks) of homologous blocks is a function of genomic evolutionary events that occurred since two homologous blocks diverged from a common ancestor [25,32].The modern soybean genome has undergone Gamma WGT (Ks > 1.5), Legume WGD (Ks ~ 0.3 to 1.5) andGlycineWGD (Ks ~ 0 to 0.3) [24,25].To analyze the soybeanPHTgene duplication relationship,Medicago truncatula, which experienced the Gamma WGT event and Legume WGD event [33], was selected as the reference gene order and 9Medicago PHT1s were identified (Additional file5B).
Based on the analysis of homologous genomic regions, seven paralogGmPHT1gene pairs fell into 14 syntenic blocks and diverged after the Glycine WGD event. This was based on each pair of blocks having collinearity, with the averageKsranging from 0.19 to 0.25 (Figure1A, Additional file5C). Although the paralog gene ofGmPHT1;11was lost in the syntenic block of chromosome 2, the block containingGmPHT1;11underwentGlycineWGD events (Figure1A and Additional file5C). Because the homologous block containingMtPHT4on Chromosome 5 inM. truncatulahad a collinearity with the block harboringGmPHT1;11(Additional file5B). With the exception of the WGD duplication, the ancestor of two paralog gene pairs,GmPHT1;1/5andGmPHT1;6/10,经验丰富的豆类W前串联重复GD event. Because the blocks embodyingGmPHT1;1/6andGmPHT1;5/10had a collinearity with the block containing two tandem genes,MtPHT5and7,on Chromosome 1 ofM. truncatula(Additional file5B).
Based on the averageKsvalues for the homologous blocks (Additional file5C), the evolution history of all 15PHT1genes was predicted. ThesePHT1genes were categorized into four subgroups, GmPHT1A through D (Figure1B). For example, GmPHT1A included eight syntenic blocks, which represented five paralog gene pairs ofPHT1genes,GmPHT1;2/7,GmPHT1;4/15,GmPHT1;1/5,GmPHT1;6/10andGmPHT1;3/14. Both GmPHT1B and GmPHT1C contained two syntenic blocks and each contained one paralog gene pair ofPHT1genes, GmPHT1;8/9andGmPHT1;12/13, respectively. GmPHT1D group was made up of two syntenic blocks and contained theGmPHT1;11gene. These results indicated the soybean PHT1 gene family originates from four distinct ancestors, at least prior to the Gamma WGT event.
Divergence ofGmPHT1expressions in different tissues and in developmental stages
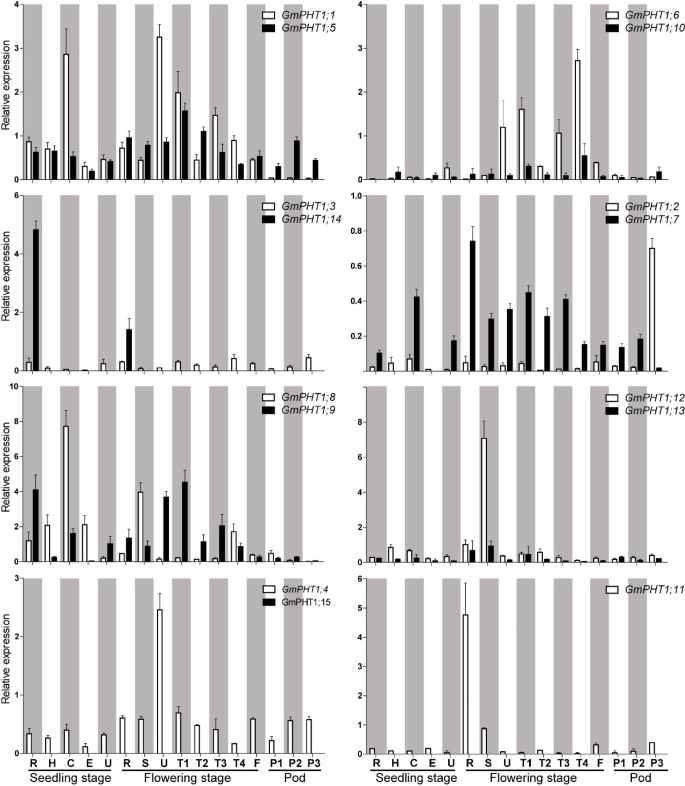
重复基因通常表现出增强的表达ssion divergence, thus gene expression changes shape evolutionary rates of proteins and re-establish the gene balance after duplication [34].Based on the spatio-temporal expression ofGmPHT1genes through real time quantitative RT-PCR (qRT-PCR), most paralog gene pairs co-expressed in 16 tissues (Figure2, Additional file5D). However, two paralog gene pairs demonstrated obvious expression pattern differences.GmPHT1;14,was only expressed roots, but the expression of its paralog gene,GmPHT1;3, was detected at low level in all samples. And theGmPHT1;2paralog gene,GmPHT1;7, did not express in hypocotyls and epicotyls at the seedling stage.
The spatio-temporal transcription ofGmPHT1.R, H, C, E, U, S, T1, T2, T3, T4, F: the root, hypocotyl, cotyledon, epicotyls, unifoliolate leaf, the stem, the first trifoliolate leaf, the second trifoliolate leaf, the third trifoliolate leaf, the fourth trifoliolate leaf and the flower, respectively. And P1, P2, and P3: seven, fourteen and twenty one days after the onset of flowering, respectively. The geometric means ofGmSKIP16andGmUNKI成绩单记录被用作参考。The values are means of three replicates and each replicate represented a pool from at least five plants. Error bars represent SD.
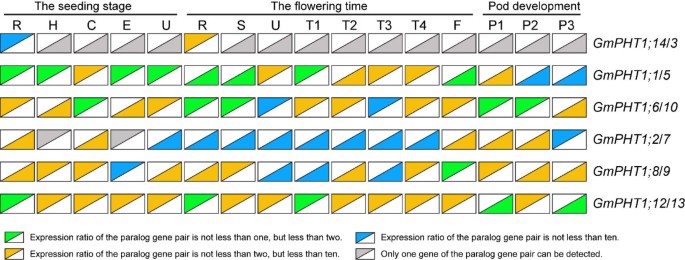
The expression levels among paralog gene pairs demonstrated clear divergence (Figure3). Among the six paralog gene pairs, 80 pairs of co-expression values were obtained from 16 tissues. The overall expression levels difference were as follows, ~24% had between a 1 to 2 fold change, ~ 54% between a 2 -to 10 fold change, and ~ 22% had more than a 10-fold change. Moreover, gene-biased expression levels between a paralog gene pair were observed. For example, one paralog gene pair,GmPHT1;2andGmPHT1;7displayed expression biased toGmPHT1;2in 15 tissues, only different in the pods after 21 FAD. In addition, expressions were biased to GmPHT1;12 between the paralog gene pair,GmPHT1;12andGmPHT1;13(Figure3).
The transcript divergence of six paralogous pairs of genes within a given tissue in different developmental stages.The upper triangles showed the expression of the lift genes of the paralog gene pairs, and the lower triangle the expression of the right genes of the paralog gene pairs. The raw average relative expressions were in the Additional file5D. R, H, C, E, U, S, T1, T2, T3, T4, F: the root, hypocotyl, cotyledon, epicotyls, unifoliolate leaf, the stem, the first trifoliolate leaf, the second trifoliolate leaf, the third trifoliolate leaf, the fourth trifoliolate leaf and the flower, respectively. And P1, P2, and P3: seven, fourteen and twenty one days after the onset of flowering respectively. The geometric means ofGmSKIP16andGmUNKItranscripts were used as the reference transcript.
GmPHT1genes differential response to the Pi stress
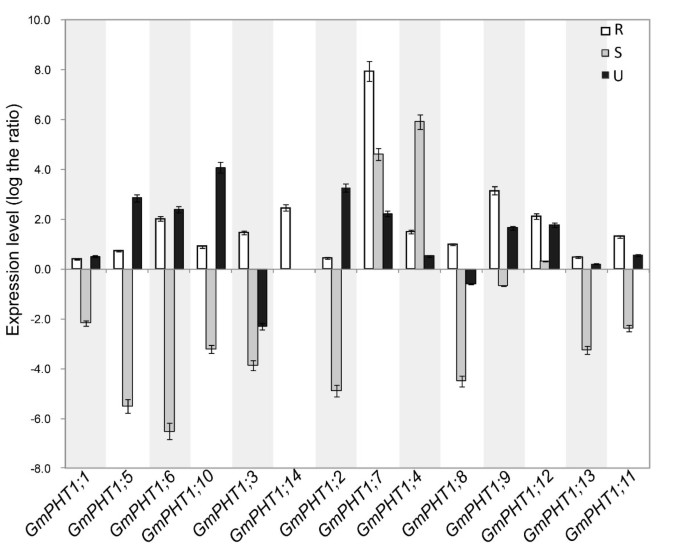
Plant root performance dependents directly on Pi availability in soil [35].Pi stress induces most of the knownPHT1sgenes (Review in [14,17,18]). To investigateGmPHT1responses under low Pi (Pi = 1 μM) stress conditions, soybean PHT1 gene expressions were evaluated in the root, stem and leaf, at the vegetative stage (Figure4). Compared with expressions under high Pi (Pi = 500 μM) conditions, all soybeanPHT1genes were up-regulated in roots under the low Pi condition. Divergent expressions of some paralogs were observed in stem or leaf tissues (Figure4). ExceptGmPHT1;4,7and12, transcriptions of other soybenPHT1genes were down-regulated in stems under low Pi conditions. Additionally, expressions ofGmPHT1;3and8were induced by the high Pi condition in leaves.
GmPHT1transcription in the response to the low Pi (1 μM) stress.At least five individual plants per treatment were harvested when the unifoliolate leaves fully expanded. The transcript abundance ofGmPHT1genes in the roots (R), stems (S) and unifoliolate leaves (U) were shown using the expression of the 500 μM Pi treatment group as a control. The geometric means ofGmSKIP16andGmUNKItranscripts were used as the reference transcript. The values are means of three replicates and each replicate represented a pool from at least five plants. Error bars represent SD.
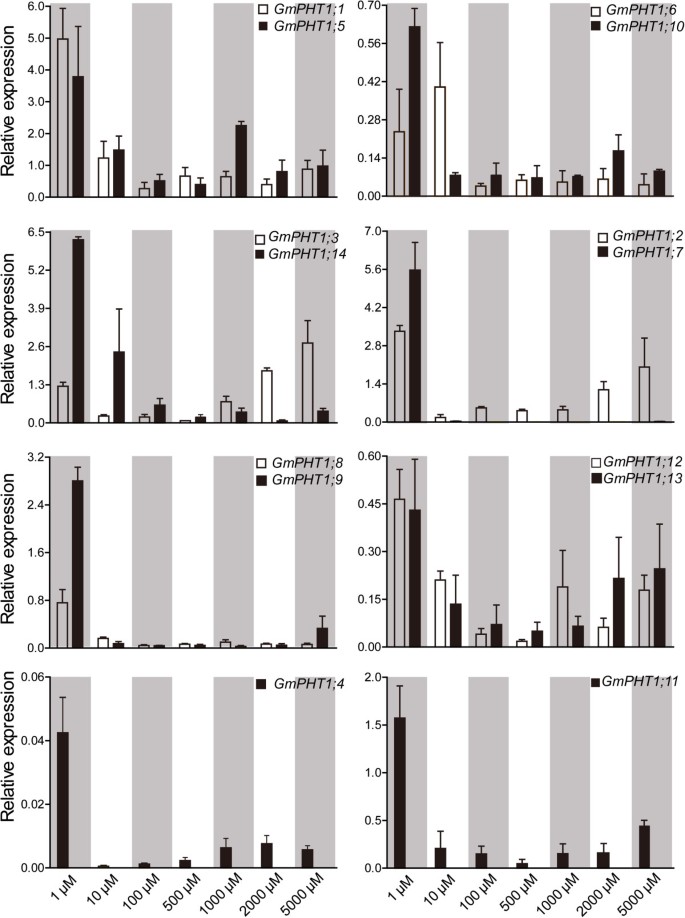
In addition to under the low Pi condition, the responses ofGmPHT1genes to a series of Pi concentrations in the roots were employed to investigate the expression divergence of the paralog gene pairs (Figure5). Compared with those under the low Pi (Pi = 1 μM) condition, expressions of all 13GmPHT1genes were significantly supressed in the roots under the Pi = 10 μM condition exceptGmPHT1;6. And when the external Pi concentration was more than 10 μM, the range of expressions were very narrow exceptGmPHT1;2,GmPHT1;3, GmPHT1;12andGmPHT1;13. That indicated most paralog gene pairs showed the similar responses to the external Pi in the root exceptGmPHT1;2/7andGmPHT1;3/14. And under the high-Pi condition, the transcriptions ofGmPHT1;2andGmPHT1;3were induced, but the strength were lower than under the low Pi condition (Figure5). That suggested thatGmPHT1;2andGmPHT1;3may contributed to Pi tolerance in soybean.
GmPHT1transcription in the root is affected by external Pi concentration.Roots of at least five individual plants per treatment were harvested when the unifoliolate leaves fully expanded. Different paralogous pair genes were plotted in individual figures. The geometric means ofGmSKIP16andGmUNKItranscripts were used as the reference transcript. The values are means of three replicates and each replicate represented a pool from at least five plants. Error bars represent SD.
Divergence in the Pi transport activities of GmPHT1 in yeast
To investigate the divergence of 14 soybeanPHT1sin the Pi transport ability, the abilities of heterologous complementation of yeast double mutant (PAM2,Δpho84Δpho89) [36] were tested on the nutrition defect media (Additional file6). The resulting sequences were confirmed by sequencing and cloned into pYES-DEST52 drive byGAL1promoter.
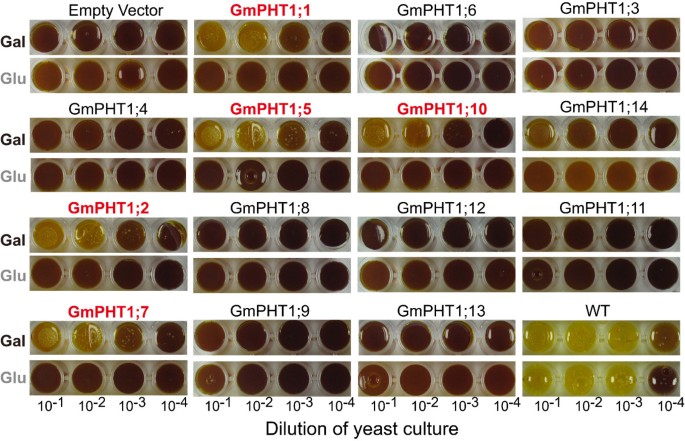
As Figure6shown, only one paralog gene pairs,GmPHT1;6/10, showed difference of complementation ability. And PAM2 cells carryingGmPHT1;1,GmPHT1;2,GmPHT1;5,GmPHT1;7, andGmPHT1;10grew well on the induced modified SD media (the carbon source is galactose) under the low Pi condition, whereas PAM2 cells harboring other 9GmPHT1and the empty vector did not grow normally under the same conditions. This data suggested thatGmPHT1;1,GmPHT1;2,GmPHT1;5,GmPHT1;7, andGmPHT1;10may be high-affinity phosphate transporters and others were lower-affinity ones.
Complementation analysis ofGmPHT1genes in the yeast double mutant PAM2.Wild type (WT) and mutant (PAM2) yeast strains containing either an empty pYES-DEST52 vector (Empty vector) or pYES-DEST52 (bearing one of theGmPHT1sequences). Serial dilutions were spotted onto a selective medium supplemented with low concentrations (10 μM) of Pi, with either glucose (Glu, non-induced medium) or galactose (Gal, induced medium) as the carbon source. Each spot represented 5 μl yeast culture, diluted from a master culture, as indicated. Yellow color indicates the cell in the spots grew well. Images were captured after three days.
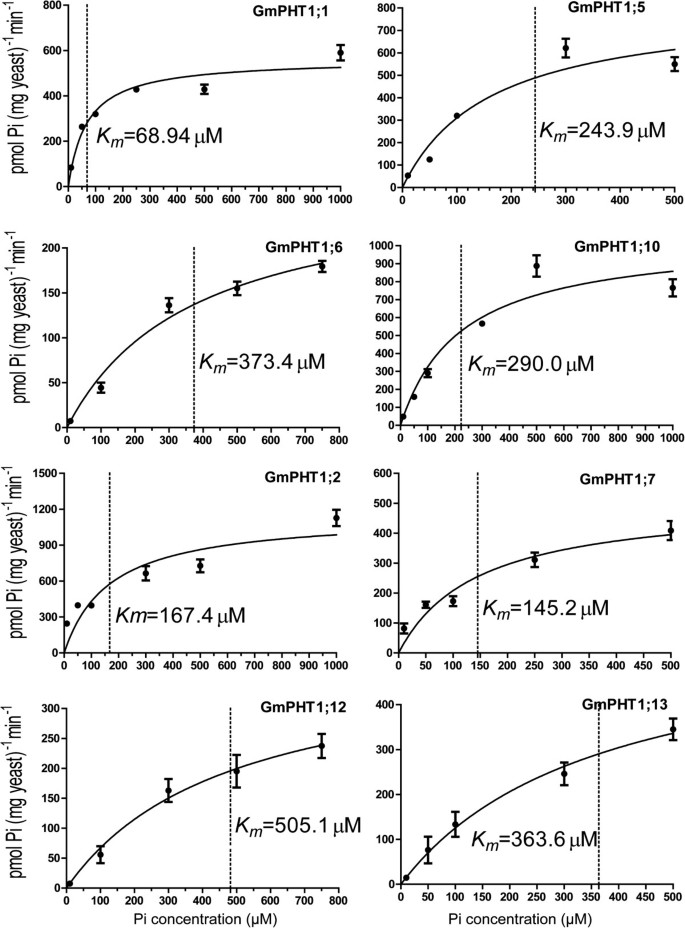
Kinetic parameters (Km) can display the affinity ability of the PHT1 proteins for transporting Pi. Subsequent32Pi uptake assays were employed to further confirm the different affinity of GmPHT1 and to analyzeKmvalues of Pi uptake of 4 paralogous pair transporters (Figure7). The paralogous gene pairs also displayed divergence on the affinity for Pi. For example, GmPHT1;1 had aKmof 68.9 μM, while its papralogous transporter GmPHT1;5 had aKmof 243.9 μM; theKmof GmPHT1;12 was 505.1 μM, whereas theKmof GmPHT1;13 was 363.6 μM, both of them were low affinity transporters.
Radioactive phosphorus (32Pi) uptake by PAM2 cells carrying aGmPHT1gene.Each point represents the average and SD of at least three uptake experiments. The concentration of external Pi was 10 μM, 50 μM, 100 μM, 300 μM, 500 μM or 1000 μM.Kmvalues are indicated next to the dot lines and gained through GraphPad Prism 5.
Divergence on the subcellular localization of GmPHT1 proteins
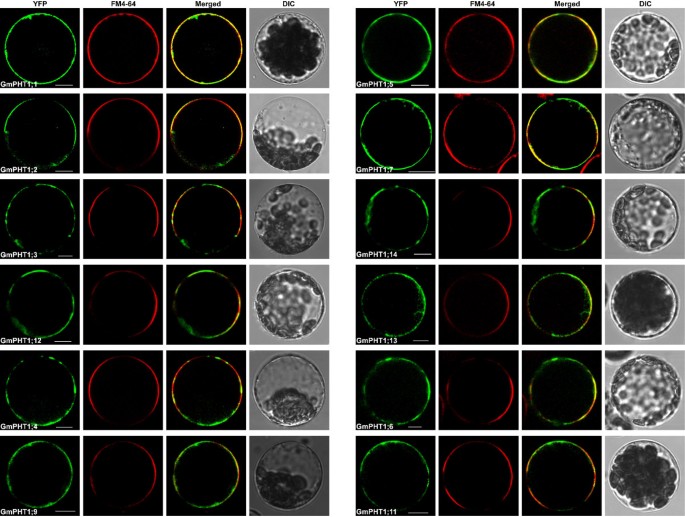
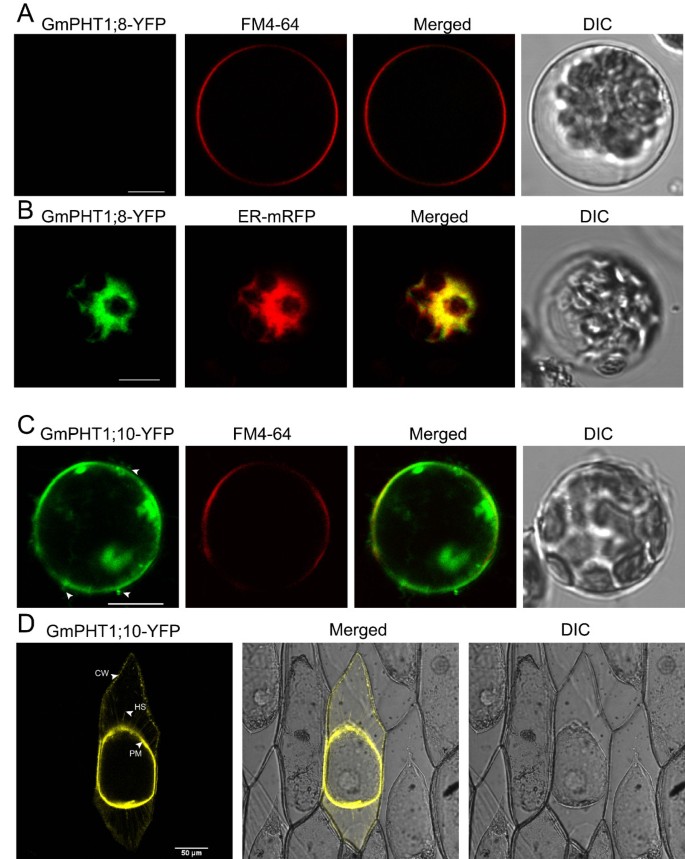
The PHT1 protein in plants primarily localizes to the plasma membrane [14,20,37].Under Pi stress they are targeted to endocytic compartments [38].To analyze subcellular localization of GmPHT1 proteins, we tagged the GmPHT1 proteins with yellow fluorescence protein (YFP) at their C-terminal. With the exception of GmPHT1;8 and GmPHT1;10, twelve GmPHT1 proteins co-localized to the plasma membrane (Figure8).
One exceptional case was the localization pattern of GmPHT1;8. Though no fluorescent signal of GmPHT1;8-YFP was detected in the plasma membrane (Figure9A), a strong signals in endoplasmic reticulum (ER) was detected. GmPHT1;8 co-localized to the ER inArabidopsismesophyll protoplasts along with ER-marker [39] (Figure9B).
Sub-cellular localization of GmPHT1;8 and GmPHT1;10 inA. thalianaprotoplasts. A, No signal of GmPHT1;8-YFP on plasma membrane. FM4-64: plasma membrane marker.B, The co-localization of GmPHT1;8-YFP with the ER specific marker mRFP.C, The subcellular localization of GmPHT1;10-YFPAnd FM4-64: plasma membrane marker. Arrow heads display extracellular signals.D, The localization of GmPHT1;10 in plasmolyzed onion epidermal cells. CW: cell wall, HS: Hechtian strands, PM: plasma membrane. Scale bar: 10 μm forA,B, andC, 50 μm forD.
Another exception was GmPHT1;10 localization. Here, GmPHT1;10 fluorescent signals were detected both at the plasma membrane as well as outside of the plasma membrane (Figure9C). These localization patterns were recapitulated in plasmolytic onion epidermal cells. Strong fluorescence was detected in cell walls, plasma membranes and Hechtian strands (Figure9D). Moreover, paralog gene,GmPHT1;6, and another gene pair,GmPHT1;1and5, presented with strong signals only in the plasma membrane (Additional file7). This pattern was a copy of that found inMedicagoMtPT3 [20] andArabidopsisPht1;1 [37].
Discussion
Different lineages of PHT1 genes undergoing different nature selections during the plant evolutionary process
Land plants only gain phosphorous from soil solutions through the root, and mostPHT1genes express and are induced by the Pi starvation or by AMF in the root [16,40,41], indicating Pi uptake is heavily dependent on the phosphate transporter 1 family in the plant. In order to adapt the low-Pi environment and improve Pi uptake, two Pi uptake pathways have evolved under the nature selection. First, the direct Pi acquisition pathway acts through modifications of root architecture, root length and lateral root numbers [42–44].The second pathway is symbiotic Pi uptake, which acts through plant/fungi interactions [29,45].
Before the occurrence of the first terrestrial plant, which were present about 475 million years ago [46], the PHT1 subfamily II has been divergent based on the phylogenic tree (Additional file4), indicating the direct Pi acquisition pathway was the main Pi acquisition pathway of ancient plants. About 460 million years ago, AMF occurred and may have played a crucial role in facilitating the colonization of land by plants most likely only consisted of plants on the bryophytic level [47].And then the PHT1 subfamily I was diverged, suggesting the subfamily I is another older evolutionary lineage. Therefore, AMF have been symbionts of land plants for at least 450 million years old, and the symbiotic Pi uptake is an evolutionarily ancient Pi acquisition strategy for plant life on land [29,48].
In the evolutionary process of plants, genome duplications were ancient and recurrent [49].They provide the important raw genetic material to adapt to challenging environment and increase the diversity of plants. New genome sequences and improved analytical approaches are clarifying angiosperm evolution and revealing patterns of differential gene loss after genome duplication and differential gene retention associated with evolution of some morphological complexity [50].According to the evolution of the PHT1 family, the members of PHT1 subfamily I and II, which are diverged eailier, were not expanded as expected in angiosperms compared with the subfamily III and IV. For example, In Arabidopsis, which is not host plant of AMF and experienced at least three polyploidy events [51], nine members of the PHT1 family were found, but no members of PHT1 subfamily I [52,53].InPopulus trichocarpa, experiencing at least two polyploidy events [54],PtPT10andPtPT8belong to the PHT1 subfamily I, andPtPT8is a pseudogene [30].In the rice, experiencing one polyploidy event [55], contain two nonredundant members of the PHT1 subfamily I,OsPT11andOsPT13[56,57].AndOsPT13is conserved and special across monocotyledons [56].In the soybean, undergoing three WGD events [23–25], three members of the PHT1 subfamily I,GmPHT1;11,12and13, were found.GmPHT1;12andGmPHT1;13, were a paralog gene pair arisen after theGlycineWGD event. And theGmPHT1;11paralog gene was lost after the Legume WGD event and thenGmPHT1;11became a singleton (Figure1). Conversely, the GmPHT1-A experienced three rounds of WGD events and is composed of 9 members with whole coding sequences, plus one pseudogene (GmPHT1;15). For the PHT1 subfamily II, about two members can be found in each plants, while members of subfamily III or IV were expanded after gene duplication (Additional file4). Taken together, different selection pressures retained different subgroups during the plant evolution.
Multiple divergences resulted in retention of paralogs from one gene family
Polyploidy is widespread and is a process that recurrently shaped eukaryotic genomes in plant. After genome duplication once fixed within species, the three possible fates of duplicated genes: neofunctionalization, subfunctionalization or nonfunctionalization [6–8,58].If the Ka/Ks value is more than 1.0, gene copies would undergo positive selection and have new functions. On the contrary, subfunctionalization would be expected to undergo purifying selection. The Ka/Ks values for all soybean PHT1 genes were less than 1.0 (Additional file5F), thus, the paralogPHT1gene pairs were undergoing purifying selections in the soybean evolution and subfunctionalized. In the soybean genome, about 75% genes are present in multiple copies, and approximately 50% of paralogs are differentially expressed and have undergone expression subfunctionalization, and only a small proportion of the duplicated genes have been neofunctionalized or non-functionalized [12], suggesting that the main fate of duplicated genes were subfunctionalization.
Although the different functions of Pi transport were that they have different affinities, all the publishedPHT1genes display conserved functions of Pi transport. In one species, the greatest difference is the divergence of their expression profile, which results in their differently functional sites in the plant. In Arabidospsis,AtPHT1;6表示只在花,AtPHT1;8and9express only in the roots [52], and transcriptions ofAtPHT1;5are detected in the old tissues and induced by ethylene [59].Additionally, mostAtPHT1genes exhibit strong expression in several tissues although their expressions overlapped to some extent [16].In angiosperms, some members of the PHT1 family, such asMtPT4, OsPT11,OsPT13,TaPHT1,HvPT8,StPT4,LePT4andPtPT10, are induced only by AMF, while transcriptions of other members, such asStPT3,OsPT1,OsPT2,OsPT3,OsPT6,OsPT9, andOsPT10are not special to AMF [30,57,60–64].The response of most PHT1 genes to the low Pi are similar, but to deficiencies of other nutrient elements, such as nitrogen, potassium, iron, and zinc, are different [27,65].Three different paralog gene pairs, show different expression patterns or levels under deficient N, K, or Fe conditions [27], suggesting another subfunctionalization event among these paralogs.
Subfunctionalization can be taken as genetic redundancy [66,67].For example, inArabidopsis, the Pi uptake rates of single mutants,pht1;1andpht1;4,were reduced about 20%, but the rate of double mutant was reduced approximately 57%, under the low-Pi condition [37].Mutations in tomato (Solanum lycopersicum)StPT4affected neither mycorrhizal Pi uptake nor establishment of the symbiotic pathway, this was due to arbuscular-mycorrhizal symbiosis triggering expression of other threePHT1genes [64].These results indicate Pi uptake functionally redundancy. The expression profiles of soybeanPHT1(Figure2), indicates extensively overlaid, these results suggest redundancy in these paralogs as well.
PHT1, as a plasma membrane protein, consists of two regions of six transmembrane domains separated by a hydrophilic loop [68,69].All the 14 soybean PHT1 proteins, like other PHT1s, contain 12 transmembrane domains (Additional file8). Up to now, the PHT1 family members were believed to localize finally to the plasma membrane (the function site) after post-translational modifications [38,70].According to our results (Figure8), the fluorescence signals of most soybean PHT1s were detected in the plasma membrane. Except the plasma membrane, the fluorescence signals of MtPT3 [20] and AtPHT1;1 [37] can be detected in hechtian strands. The subcellular localization of GmPHT1;10 in onion epidermal cells was similar to that of MtPT3 and AtPHT1;1 (Figure9D), but the same localization pattern was not observed in its paralog (Additional file9). Interestingly, the localization of GmPHT1;8 was not at the cytoplasmic membrane but at the endoplasmic reticulum (Figure9B), however its paralog, GmPHT1;9, localized to the plasma membrane.
Subfunctionalization of paralogs beneficial to soybean Pi uptake, translocation and remobilization
To enhance acquisition of external Pi, plants can morphologically regulate root architecture to enhance the root surface/soil volume ratio, also root architecture is closely related to P efficiency [40,71–74].The number and length of lateral roots and the length of primary roots increased under the low-Pi condition (Additional file9). At the molecular level, the members of PHT1 family play important roles in Pi uptake from soil solutions thus exhibiting robust expression in roots [16,40].According to our results (Figure4) and others’ [27], fourteen soybeanPHT1genes expressed in the root were up-regulated by low-Pi stress. Moreover, GmPHT1;1, 2, 5, 7, and 10 had high affinity to Pi. Thus, GmPHT1;1, 2, 5, 7, and 10 may play important roles in the direct Pi uptake from low-Pi soil solutions.
In addition to direct Pi uptake, symbiotic phosphate uptake is an ancestral Pi acquisition strategy for plants, meaning that somePHT1genes are induced by arbuscular mycorrhizas [16,29,40,63,75].In the soybean, the transcription of three soybeanPHT1genes,GmPT7,10and11(GmPHT1;11,13, and12, respectively in this study), was induced by arbuscular mycorrhizal fungi [26].These results indicate these three genes have important roles in soybean symbiotic Pi uptake.
After Pi uptake, distribution and remobilization of Pi, within the plant, is accomplished through the membrane transport systems of the shoots to the sink tissues wherever symplastic connections are lost [15,40].Although other PHT gene families, such as the PHT2 family [76], are involved the process, the PHT1 gene family localization in the plasma membrane is the most important [19,52,77,78].Based on our results,GmPHT1;7,8,10and12exhibited stronger expression than their corresponding paralog genes in the stems, at the seedling and flowering stage (Figure2), suggesting involvement in internal Pi transport in the shoots.
Another developmental signal, senescence, has been reported to strongly induced expression of somePHT1genes [30,59,79], and most leaf phosphorus is remobilized to the seed during reproductive development in soybean [80].For instance, in other plants, the expression ofPhPT1is up regulated during petunia petal senescence [79] and transcript level ofPht1;5is elevated in the old leaves inArabidopsis[59].In the soybean,GmPHT1;1expression increased in unifoliolates along with developmental process and reached the peak during flowering time (Figure2). Moreover, again during flowering time, the transcription level ofGmPHT1;1was relative to leaf ages (Figure2).This suggests thatGmPHT1;1is related to the re-utilization of Pi from older leaves. Cotyledons are the main phosphorus store tissue and the phosphorus resource tissue at the seedling stage. High expression ofGmPHT1;8was detected in the cotyledons at the seedling stage (Figure2), suggestingGmPHT1;8played an important roles in recycling Pi from cotyledons.
Different subcellular localizations of GmPHT1 proteins correlated to cellular homeostasis according to our findings. Although the majority of GmPHT1 proteins localized on cytoplasma membrane (Figure8), similarly to PHT1s in other plants [81], GmPHT1;8 and GmPHT1;10 have unique localization patterns. GmPHT1;10 localized to Hechtian strands in addition to the cytoplasma membrane and cell walls. These Hechtian transporters may play critical roles in Pi transport between the cytoplasmic membrane and cell wall or between cells [82].Perhaps, GmPHT1;10 had important roles in the cross talk of Pi flux or signals amongst the cells. In addition, GmPHT1;8 localized, exclusively, to the endomembrane system instead of cytoplasma membrane (Figure9B). A functional auxin transporter, AtPIN5, does not have a direct role in cell-to-cell transport but regulates intracellular auxin homeostasis and localizes to endoplasmic reticulum (ER), unlike other characterized plasma membrane PIN proteins [83].Given the function of the AtPIN5, this result may indicate GmPHT1;8 has a role in regulating intracellular Pi homeostasis and metabolism.
Conclusion
In the soybean, there were 14PHT1genes with full whole CDS plus one pseudogene, and they originated from four different different ancestors, GmPHT1A, B, C and D, before the Gamma WGT events in the soybean evolution history. Three polyploidy events expanded the members of GmPHT1A. In addition, one tandem duplication also increased the members of GmPHT1A after the Legume WGD and before theGlycineWGD。The retentions of paralog genes of GmPHT1B and C were only after theGlycineWGD。GmPHT1D集装箱d one member, of which paralog gene was lost. Fourteen soybeanPHT1s underwent the purifying selection and had the conserved function in Pi uptake although they had different affinities for Pi, andGmPHT1;15experienced pseudogenization. Expression divergence levels were the main style of subfunctionalization of the paralog gene pairs. The expression ratios were more than two amongst paralog gene pairs in about 76% co-expression tissues. Although 14 soybeanPHT1genes more strongly expressed in the roots under the low Pi condition, the response extent were different. Similar subcelluar localizations to the plasma membrane were found amongst most soybean PHT1 proteins. But GmPHT1;8 was not localized to the plasma membrane but to the endoplasmic reticulum, while GmPHT1;10 was localized to Hechtian strands in addition to plasma membranes.
Methods
Plant materials
We employed the soybean cultivar (KN18) in all experiments. Plants were grown in a growth chamber under short day conditions (8 hr light/16 hr dark) at a temperature 25°C ~ 28°C. Tissues harvested at two different developmental stages, fully expanded unifoliolate leaf and flowering onset, were evaluated forGmPHT1expression patterns and levels in different tissues. We collected pods samples 7, 14 and 21days after flowering. To investigate the effect of external Pi concentrations ofGmPHT1transcription, plants raised in a hydroponic culture with an initial Pi concentration of 500 μM. Once unifoliolate leaves were fully expanded, the culture solution Pi concentration was changed to 1 μM, 10 μM, 100 μM, 500 μM, 1 mM, 2 mM or 5 mM. Solutions were refreshed once every two days over the course of one week. Each experimental group, containing a minimum of five individual plants per group, was harvested, frozen in liquid nitrogen and stored at -80°C until required. All experiments were repeated three times under the consistent conditions.
Identification, cloning and expression vector construction of soybeanPHT1genes
Soybean genome sequences (version 1.09), downloaded from Phytozome V 8.0, and used to obtain a set of knownPHT1sequences (Additional file1). Members of theGmPHT1family (Additional file5F) were identified using profile hidden Markov models built by HMMER v3.0 [84], following the HMMER user guide. TheGmPHT1gene nomenclature is presented in Additional file5F. A pseudogene (GmPHT1;15) was predicted from syntenic analysis using the PGDD or CoGe database.
Given the sequence similarity between the 14PHT1genes in this study, we designed primers specific to the 5′or 3′UTR of each gene (Additional file5F) for RT-PCR. Subsequently, these sequences were used as templates to clone the CDSs with corresponding primers (Additional file5E) into an entry vector pGWC [85),下一个基因重组成一个合适的yeast expression vector, pYES-DEST52 (Invitrogen), and plant expression vectors, pEXSG-YFP-GW, with Gateway technology.
Bioinformatic analysis
To identify the intra-genome (G. max) or cross-genome (G. maxandM. truncatula) syntenic relationships we employed, SynMap (http://genomevolution.org/CoGe/SynMap.pl). To investigate the synteny of blocks containingPHT1genes, homology data derived from CDS–CDS comparisons made using Blastz, with an E-value cutoff of 1e-5, other parameters were default or recommended. The nine members of the PHT1 gene family was identified (Additional file5B) inM. truncatulaas above.
Transmembrane (TM) domains of PHT genes were predicted by TopPred 2 (http://bioweb.pasteur.fr/seqanal/interfaces/toppred.html) [86].PLACE [31] (http://www.dna.affrc.go.jp/PLACE/signalscan.html) was employed to scan thecis-acting elements of the predicted promoter sequences for everyGmPHT1genes. After alignment of the fullGmPHT1genes’ CDS by ClustalW (http://www.ebi.ac.uk/Tools/msa/clustalw2/), Ka (non-synonymous substitutions per non-synonymous site) and Ks (synonymous substitutions per synonymous site) of the paralog genes was computed by DnaSP v5 (Additional file5F) [87].
Yeast manipulations
The yeast Pi uptake-defective mutant PAM2 (Δpho84Δpho89) [36] was employed to identify the Pi transport activities of the 14 GmPHT1 genes. All GmPHT1 yeast recombinant expression vectors carryingPHT1CDS were transformed into PAM2. Transformed cells grew to logarithmic phase in a synthetic liquid medium (SM, 1 liter: 5.9 g YNB (CYN0804, For Medium), 0.77 g mixture of amino acid without Ura (Clontech), 2% raffinose, 6 mM Pi, pH5.8). The cells were harvested when enter the log phase, washed with Pi-free medium, and re-suspended in the same medium to different concentration. For yeast mutant complementation experiments, the yeast cells dilution were plated onto solid, induced or non-induced, medium (1 liter: 5.9 g YNB, 0.77 g mixture of amino acid without Ura, 2% galactose or glucose, 2% agar (#05038, sigma), 10 μM Pi, pH 6.5). Potassium was supplemented with equivalent KCl, and 0.04% bromocresol purple was used as a pH indicator [19], plates were incubated at 30°C, for 3 days. We performed Pi uptake experiments using32Pi as previously reported [20].Yeast cells grew in liquid, non-induced medium (1 mM Pi) for 6 hr, cells were harvested, and then washed with the Pi-free medium 3 times. Next, yeast cells were grown in liquid, induced medium, without Pi, for 4 hours, harvested and washed with water 3 times. After the final wash, cells were resuspended at 200 mg cells/ml−1. Cell suspension 30 μL was added to YNB medium (570 μl), containing 25 mM sodium citrate (pH4.5), 2% glucose and appropriate concentration gradient of Pi (10 μM, 50 μM, 100 μM, 300 μM, 500 μM or 1000 μM). Radioactive32Pi was added to the yeast solution at a final concentration of 0.125 μCi, and cells were incubated at 30°C with gentle agitation for 3 min. Immediately, we added 4 ml of ice-cold stop solution (25 mM sodium citrate buffer, pH 4.5) transferred onto glass fiber filters and washed with an additional 4 ml of stop solution. A scintillation spectroscopy measured the samples radioactivity. All experiments were repeated three times with similar results. The kinetic data was analyzed by nonlinear regression with GraphPad Prism 5 software.
Total RNA isolation and quantitative reverse transcription-PCR (RT-qPCR)
The procedures used for RNA extraction and cDNA synthesis are as described by Hu,et al[88].All expression experiments were repeated a minimum of three times. The primers for the 15PHT1genes examined by qRT-PCR are listed in Additional file5F and 14 of the primer pairs had an efficiency greater than 90% as determined by LinRegPCR (http://LinRegPCR.HFRC.nl) [89].GmSKIP16, andGmUNK1were used as reference genes for all qRT-PCRs [88].The relative expression was computed following the formula 2(Cta-Ctb), where Cta and Ctb are the average Ctvalues of the reference and target genes, respectively.
Subcellular localization analysis
Transient expression of YFP tagged GmPHT1 were performed inArabidopsismesophyll protoplasts through PEG–calcium transfection [90] and in onion epidermal cells by bombardment [20].Experiments were carried out to analyze subcellular localizations of 14 GmPHT proteins and to investigate the cellular localization of GmPHT1 proteinsin vivo.Specific subcellular organelles markers, plasma membrane (FM4-64) [91] and endoplasmic reticulum (ER-mRFP) [39], were selected. Section Z-series images were collected at different intervals throughout the specimens to facilitate observation. Twenty to thirty cells were imaged for each experiment. Post-acquisition image analysis and processing was performed using MBF ImageJ, version 1.46.
References
Edger PP, Pires JC: Gene and genome duplications: the impact of dosage-sensitivity on the fate of nuclear genes. Chromosome Res. 2009, 17 (5): 699-717. 10.1007/s10577-009-9055-9.
Wang Y, Wang X, Paterson AH: Genome and gene duplications and gene expression divergence: a view from plants. Ann N Y Acad Sci. 2012, 1256: 1-14. 10.1111/j.1749-6632.2011.06384.x.
Buggs RJ, Elliott NM, Zhang L, Koh J, Viccini LF, Soltis DE, Soltis PS: Tissue-specific silencing of homoeologs in natural populations of the recent allopolyploid Tragopogon mirus. New Phytol. 2010, 186 (1): 175-183. 10.1111/j.1469-8137.2010.03205.x.
Conant GC, Wolfe KH: Turning a hobby into a job: how duplicated genes find new functions. Nat Rev Genet. 2008, 9 (12): 938-950. 10.1038/nrg2482.
Freeling M: Bias in plant gene content following different sorts of duplication: tandem, whole-genome, segmental, or by transposition. Annu Rev Plant Biol. 2009, 60: 433-453. 10.1146/annurev.arplant.043008.092122.
Cusack BP, Wolfe KH: When gene marriages don’t work out: divorce by subfunctionalization. Trends in genetics: TIG. 2007, 23 (6): 270-272. 10.1016/j.tig.2007.03.010.
Blanc G, Wolfe KH: Functional divergence of duplicated genes formed by polyploidy during Arabidopsis evolution. Plant Cell. 2004, 16 (7): 1679-1691. 10.1105/tpc.021410.
Moore RC, Purugganan MD: The evolutionary dynamics of plant duplicate genes. Curr Opin Plant Biol. 2005, 8 (2): 122-128. 10.1016/j.pbi.2004.12.001.
Schnable JC, Springer NM, Freeling M: Differentiation of the maize subgenomes by genome dominance and both ancient and ongoing gene loss. Proc Natl Acad Sci USA. 2011, 108 (10): 4069-4074. 10.1073/pnas.1101368108.
Thomas BC, Pedersen B, Freeling M: Following tetraploidy in an Arabidopsis ancestor, genes were removed preferentially from one homeolog leaving clusters enriched in dose-sensitive genes. Genome Res. 2006, 16 (7): 934-946. 10.1101/gr.4708406.
Woodhouse MR, Schnable JC, Pedersen BS, Lyons E, Lisch D, Subramaniam S, Freeling M: Following tetraploidy in maize, a short deletion mechanism removed genes preferentially from one of the two homologs. PLoS Biol. 2010, 8 (6): e1000409. 10.1371/journal.pbio.1000409.
Roulin A, Auer PL, Libault M, Schlueter J, Farmer A, May G, Stacey G, Doerge RW, Jackson SA: The fate of duplicated genes in a polyploid plant genome. The Plant journal: for cell and molecular biology. 2012, 73 (1): 143-153.
Fernandez A, Tzeng YH, Hsu SB: Subfunctionalization reduces the fitness cost of gene duplication in humans by buffering dosage imbalances. BMC Genomics. 2011, 12: 604. 10.1186/1471-2164-12-604.
Nussaume L, Kanno S, Javot H, Marin E, Pochon N, Ayadi A, Nakanishi TM, Thibaud MC: Phosphate Import in Plants: Focus on the PHT1 Transporters. Front Plant Sci. 2011, 2: 83.
Schachtman DP, Reid RJ, Ayling SM: Phosphorus uptake by plants: from soil to cell. Plant Physiol. 1998, 116 (2): 447-453. 10.1104/pp.116.2.447.
Nussaume L, Kanno S, Javot H, Marin E, Nakanishi TM, Thibaud M-C: Phosphate import in plants: focus on the PHT1 transporters. Frontiers in Plant Science. 2011, 2: 83.
Bucher M: Functional biology of plant phosphate uptake at root and mycorrhiza interfaces. New Phytol. 2007, 173 (1): 11-26. 10.1111/j.1469-8137.2006.01935.x.
Lambers H, Raven JA, Shaver GR, Smith SE: Plant nutrient-acquisition strategies change with soil age. Trends Ecol Evol. 2008, 23 (2): 95-103. 10.1016/j.tree.2007.10.008.
Ai P, Sun S, Zhao J, Fan X, Xin W, Guo Q, Yu L, Shen Q, Wu P, Miller AJ: Two rice phosphate transporters, OsPht1;2 and OsPht1;6, have different functions and kinetic properties in uptake and translocation. Plant J. 2009, 57 (5): 798-809. 10.1111/j.1365-313X.2008.03726.x.
Liu J, Versaw WK, Pumplin N, Gomez SK, Blaylock LA, Harrison MJ: Closely related members of theMedicago truncatulaPHT1 phosphate transporter gene family encode phosphate transporters with distinct biochemical activities. J Biol Chem. 2008, 283 (36): 24673-24681. 10.1074/jbc.M802695200.
Lu Q, Zhao J, Tian J, Chen L, Sun Z, Guo Y, Lu X, Gu M, Xu G, Liao H: The high-affinity phosphate transporter GmPT5 regulates phosphate transport to nodules and nodulation in soybean. Plant Physiol. 2012, 159 (4): 1634-1643. 10.1104/pp.112.199786.
雷,Cybinski DH, Jarmey JM,史密斯弗兰克-威廉姆斯:成立rization of two phosphate transporters from barley; evidence for diverse function and kinetic properties among members of the Pht1 family. Plant Mol Biol. 2003, 53 (1–2): 27-36.
Schmutz J, Cannon SB, Schlueter J, Ma J, Mitros T, Nelson W, Hyten DL, Song Q, Thelen JJ, Cheng J: Genome sequence of the palaeopolyploid soybean. Nature. 2010, 463 (7278): 178-183. 10.1038/nature08670.
Schlueter JA, Lin JY, Schlueter SD, Vasylenko-Sanders IF, Deshpande S, Yi J, O’Bleness M, Roe BA, Nelson RT, Scheffler BE: Gene duplication and paleopolyploidy in soybean and the implications for whole genome sequencing. BMC Genomics. 2007, 8: 330. 10.1186/1471-2164-8-330.
Severin AJ, Cannon SB, Graham MM, Grant D, Shoemaker RC: Changes in twelve homoeologous genomic regions in soybean following three rounds of polyploidy. Plant Cell. 2011, 23 (9): 3129-3136. 10.1105/tpc.111.089573.
Tamura Y, Kobae Y, Mizuno T, Hata S: Identification and expression analysis of arbuscular mycorrhiza-inducible phosphate transporter genes of soybean. Biosci Biotechnol Biochem. 2012, 76 (2): 309-313. 10.1271/bbb.110684.
Qin L, Guo Y, Chen L, Liang R, Gu M, Xu G, Zhao J, Walk T, Liao H: Functional characterization of 14 pht1 family genes in yeast and their expressions in response to nutrient starvation in soybean. PLoS One. 2012, 7 (10): e47726. 10.1371/journal.pone.0047726.
Wu Z, Zhao J, Gao R, Hu G, Gai J, Xu G, Xing H: Molecular cloning, characterization and expression analysis of Two members of the Pht1 family of phosphate transporters inGlycine max. PLoS One. 2011, 6 (6): e19752. 10.1371/journal.pone.0019752.
Karandashov V, Bucher M: Symbiotic phosphate transport in arbuscular mycorrhizas. Trends Plant Sci. 2005, 10 (1): 22-29. 10.1016/j.tplants.2004.12.003.
Loth-Pereda V, Orsini E, Courty PE, Lota F, Kohler A, Diss L, Blaudez D, Chalot M, Nehls U, Bucher M: Structure and expression profile of the phosphate Pht1 transporter gene family in mycorrhizalPopulus trichocarpa. Plant Physiol. 2011, 156 (4): 2141-2154. 10.1104/pp.111.180646.
Higo K, Ugawa Y, Iwamoto M, Korenaga T: Plant cis-acting regulatory DNA elements (PLACE) database: 1999. Nucleic Acids Res. 1999, 27 (1): 297-300. 10.1093/nar/27.1.297.
Beilstein MA, Nagalingum NS, Clements MD, Manchester SR, Mathews S: Dated molecular phylogenies indicate a miocene origin for arabidopsis thaliana. Proc Natl Acad Sci USA. 2010, 107 (43): 18724-18728. 10.1073/pnas.0909766107.
Young ND, Debelle F, Oldroyd GED, Geurts R, Cannon SB, Udvardi MK, Benedito VA, Mayer KFX, Gouzy J, Schoof H: The Medicago genome provides insight into the evolution of rhizobial symbioses. Nature. 2011, 480 (7378): 520-524.
Subramanian S, Kumar S: Gene expression intensity shapes evolutionary rates of the proteins encoded by the vertebrate genome. Genetics. 2004, 168 (1): 373-381. 10.1534/genetics.104.028944.
亚伯:磷酸根发展的感应。坏蛋r Opin Plant Biol. 2011, 14 (3): 303-309. 10.1016/j.pbi.2011.04.007.
Martinez P, Persson BL: Identification, cloning and characterization of a derepressible Na+-coupled phosphate transporter inSaccharomyces cerevisiae. Mol Gen Genet. 1998, 258 (6): 628-638. 10.1007/s004380050776.
Shin H, Shin HS, Dewbre GR, Harrison MJ: Phosphate transport in Arabidopsis: Pht1;1 and Pht1;4 play a major role in phosphate acquisition from both low- and high-phosphate environments. Plant J. 2004, 39 (4): 629-642. 10.1111/j.1365-313X.2004.02161.x.
Bayle V, Arrighi J-F, Creff A, Nespoulous C, Vialaret J, Rossignol M, Gonzalez E, Paz-Ares J, Nussaume L:Arabidopsis thalianahigh-affinity phosphate transporters exhibit multiple levels of posttranslational regulation. Plant Cell. 2011, 23 (4): 1523-1535. 10.1105/tpc.110.081067.
Nelson BK, Cai X, Nebenfuhr A: A multicolored set of in vivo organelle markers for co-localization studies in Arabidopsis and other plants. Plant J. 2007, 51 (6): 1126-1136. 10.1111/j.1365-313X.2007.03212.x.
Smith FW, Mudge SR, Rae AL, Glassop D: Phosphate transport in plants. Plant Soil. 2003, 248 (1): 71-83.
Raghothama KG: Phosphate transport and signaling. Curr Opin Plant Biol. 2000, 3 (3): 182-187.
Miura K, Lee J, Gong Q, Ma S, Jin JB, Yoo CY, Miura T, Sato A, Bohnert HJ, Hasegawa PM: SIZ1 regulation of phosphate starvation-induced root architecture remodeling involves the control of auxin accumulation. Plant Physiol. 2011, 155 (2): 1000-1012. 10.1104/pp.110.165191.
Svistoonoff S, Creff A, Reymond M, Sigoillot-Claude C, Ricaud L, Blanchet A, Nussaume L, Desnos T: Root tip contact with low-phosphate media reprograms plant root architecture. Nat Genet. 2007, 39 (6): 792-796. 10.1038/ng2041.
Lopez-Bucio J, Cruz-Ramirez A, Herrera-Estrella L: The role of nutrient availability in regulating root architecture. Curr Opin Plant Biol. 2003, 6 (3): 280-287. 10.1016/S1369-5266(03)00035-9.
Karandashov V, Nagy R, Wegmuller S, Amrhein N, Bucher M: Evolutionary conservation of a phosphate transporter in the arbuscular mycorrhizal symbiosis. Proc Natl Acad Sci USA. 2004, 101 (16): 6285-6290. 10.1073/pnas.0306074101.
Wellman CH, Osterloff PL, Mohiuddin U: Fragments of the earliest land plants. Nature. 2003, 425 (6955): 282-285. 10.1038/nature01884.
Redecker D, Kodner R, Graham LE: Glomalean fungi from the Ordovician. Science. 2000, 289 (5486): 1920-1921. 10.1126/science.289.5486.1920.
Bonfante P,有益的类型:机制ial plant-fungus interactions in mycorrhizal symbiosis. Nat Commun. 2010, 1: 48.
Adams KL, Wendel JF: Polyploidy and genome evolution in plants. Curr Opin Plant Biol. 2005, 8 (2): 135-141. 10.1016/j.pbi.2005.01.001.
Tang H, Bowers JE, Wang X, Ming R, Alam M, Paterson AH: Synteny and collinearity in plant genomes. Science. 2008, 320 (5875): 486-488. 10.1126/science.1153917.
Blanc G, Hokamp K, Wolfe KH: A recent polyploidy superimposed on older large-scale duplications in the Arabidopsis genome. Genome Res. 2003, 13 (2): 137-144. 10.1101/gr.751803.
Mudge SR, Rae AL, Diatloff E, Smith FW: Expression analysis suggests novel roles for members of the Pht1 family of phosphate transporters in Arabidopsis. Plant J. 2002, 31 (3): 341-353. 10.1046/j.1365-313X.2002.01356.x.
Okumura S, Mitsukawa N, Shirano Y, Shibata D: Phosphate transporter gene family ofArabidopsis thaliana. DNA Res. 1998, 5 (5): 261-269. 10.1093/dnares/5.5.261.
Tuskan GA, Difazio S, Jansson S, Bohlmann J, Grigoriev I, Hellsten U, Putnam N, Ralph S, Rombauts S, Salamov A: The genome of black cottonwood,Populus trichocarpa(Torr. & Gray). Science. 2006, 313 (5793): 1596-1604. 10.1126/science.1128691.
Guyot R, Keller B: Ancestral genome duplication in rice. Genome / National Research Council Canada = Genome / Conseil national de recherches Canada. 2004, 47 (3): 610-614. 10.1139/g04-016.
Yang SY, Gronlund M, Jakobsen I, Grotemeyer MS, Rentsch D, Miyao A, Hirochika H, Kumar CS, Sundaresan V, Salamin N: Nonredundant Regulation of Rice Arbuscular Mycorrhizal Symbiosis by Two Members of the PHOSPHATE TRANSPORTER1 Gene Family. Plant Cell. 2012, 24 (10): 4236-4251. 10.1105/tpc.112.104901.
Paszkowski U, Kroken S, Roux C, Briggs SP: Rice phosphate transporters include an evolutionarily divergent gene specifically activated in arbuscular mycorrhizal symbiosis. Proc Natl Acad Sci USA. 2002, 99 (20): 13324-13329. 10.1073/pnas.202474599.
Hurles M: Gene duplication: the genomic trade in spare parts. PLoS Biol. 2004, 2 (7): E206. 10.1371/journal.pbio.0020206.
Nagarajan VK, Jain A, Poling MD, Lewis AJ, Raghothama KG, Smith AP: Arabidopsis Pht1;5 Mobilizes Phosphate between Source and Sink Organs and Influences the Interaction between Phosphate Homeostasis and Ethylene Signaling. Plant Physiol. 2011, 156 (3): 1149-1163. 10.1104/pp.111.174805.
Pumplin N, Zhang X, Noar RD, Harrison MJ: Polar localization of a symbiosis-specific phosphate transporter is mediated by a transient reorientation of secretion. Proc Natl Acad Sci. 2012, 109 (11): E665-E672.
Harrison MJ, Dewbre GR, Liu J: A phosphate transporter fromMedicago truncatulainvolved in the acquisition of phosphate released by arbuscular mycorrhizal fungi. Plant Cell. 2002, 14 (10): 2413-2429. 10.1105/tpc.004861.
Kobae Y, Hata S: Dynamics of periarbuscular membranes visualized with a fluorescent phosphate transporter in arbuscular mycorrhizal roots of rice. Plant Cell Physiol. 2010, 51 (3): 341-353. 10.1093/pcp/pcq013.
Javot H, Pumplin N, Harrison MJ: Phosphate in the arbuscular mycorrhizal symbiosis: transport properties and regulatory roles. Plant Cell Environ. 2007, 30 (3): 310-322. 10.1111/j.1365-3040.2006.01617.x.
Nagy R, Karandashov V, Chague V, Kalinkevich K, Tamasloukht M, Xu G, Jakobsen I, Levy AA, Amrhein N, Bucher M: The characterization of novel mycorrhiza-specific phosphate transporters fromLycopersicon esculentumand茄属植物tuberosumuncovers functional redundancy in symbiotic phosphate transport in solanaceous species. Plant J. 2005, 42 (2): 236-250. 10.1111/j.1365-313X.2005.02364.x.
Huang C, Barker SJ, Langridge P, Smith FW, Graham RD: Zinc deficiency up-regulates expression of high-affinity phosphate transporter genes in both phosphate-sufficient and -deficient barley roots. Plant Physiol. 2000, 124 (1): 415-422. 10.1104/pp.124.1.415.
DeLuna A, Vetsigian K, Shoresh N, Hegreness M, Colon-Gonzalez M, Chao S, Kishony R: Exposing the fitness contribution of duplicated genes. Nat Genet. 2008, 40 (5): 676-681. 10.1038/ng.123.
Gu Z, Steinmetz LM, Gu X, Scharfe C, Davis RW, Li WH: Role of duplicate genes in genetic robustness against null mutations. Nature. 2003, 421 (6918): 63-66. 10.1038/nature01198.
Henderson PJ: The 12-transmembrane helix transporters. Curr Opin Cell Biol. 1993, 5 (4): 708-721. 10.1016/0955-0674(93)90144-F.
Petersson J, Pattison J, Kruckeberg AL, Berden JA, Persson BL: Intracellular localization of an active green fluorescent protein-tagged Pho84 phosphate permease inSaccharomyces cerevisiae. FEBS Lett. 1999, 462 (1–2): 37-42.
Lau W-TW, Howson RW, Malkus P, Schekman R, O’Shea EK: Pho86p, an endoplasmic reticulum (ER) resident protein inSaccharomyces cerevisiae, is required for ER exit of the high-affinity phosphate transporter Pho84p. Proc Natl Acad Sci. 2000, 97 (3): 1107-1112. 10.1073/pnas.97.3.1107.
Raghothama KG: Phosphate Acquisition. Annu Rev Plant Physiol Plant Mol Biol. 1999, 50: 665-693. 10.1146/annurev.arplant.50.1.665.
Zhao J, Fu J, Liao H, He Y, Nian H, Hu Y, Qiu L, Dong Y, Yan X: Characterization of root architecture in an applied core collection for phosphorus efficiency of soybean germplasm. Chinese Science Bulletin. 2004, 49 (15): 1611-1620.
Williamson LC, Ribrioux SP, Fitter AH, Leyser HM: Phosphate availability regulates root system architecture in Arabidopsis. Plant Physiol. 2001, 126 (2): 875-882. 10.1104/pp.126.2.875.
Perez-Torres CA, Lopez-Bucio J, Cruz-Ramirez A, Ibarra-Laclette E, Dharmasiri S, Estelle M, Herrera-Estrella L: Phosphate availability alters lateral root development in Arabidopsis by modulating auxin sensitivity via a mechanism involving the TIR1 auxin receptor. Plant Cell. 2008, 20 (12): 3258-3272. 10.1105/tpc.108.058719.
Yang SY, Paszkowski U: Phosphate import at the arbuscule: just a nutrient?. Mol Plant Microbe Interact. 2011, 24 (11): 1296-1299. 10.1094/MPMI-06-11-0151.
Daram P, Brunner S, Rausch C, Steiner C, Amrhein N, Bucher M: Pht2;1 encodes a low-affinity phosphate transporter from Arabidopsis. Plant Cell. 1999, 11 (11): 2153-2166.
Nagy R, Vasconcelos MJV, Zhao S, McElver J, Bruce W, Amrhein N, Raghothama KG, Bucher M: Differential Regulation of FivePht1Phosphate Transporters from Maize (Zea maysL.). Plant Biology. 2006, 8 (2): 186-197. 10.1055/s-2005-873052.
Jia H, Ren H, Gu M, Zhao J, Sun S, Zhang X, Chen J, Wu P, Xu G: The Phosphate Transporter Gene OsPht1;8 Is Involved in Phosphate Homeostasis in Rice. Plant Physiol. 2011, 156 (3): 1164-1175. 10.1104/pp.111.175240.
Chapin LJ, Jones ML: Ethylene regulates phosphorus remobilization and expression of a phosphate transporter (PhPT1) during petunia corolla senescence. J Exp Bot. 2009, 60 (7): 2179-2190. 10.1093/jxb/erp092.
Lauer MJ, Blevins DG, Sierzputowska-Gracz H:31P-nuclear magnetic resonance determination of phosphate compartmentation in leaves of reproductive soybeans (Glycine maxL.) as affected by phosphate nutrition. Plant Physiol. 1989, 89 (4): 1331. 10.1104/pp.89.4.1331.
Lin WY, Lin SI, Chiou TJ: Molecular regulators of phosphate homeostasis in plants. J Exp Bot. 2009, 60 (5): 1427-1438. 10.1093/jxb/ern303.
Nick P: Signals, motors, morphogenesis—the cytoskeleton in plant development. Plant Biology. 1999, 1: 169-179. 10.1111/j.1438-8677.1999.tb00240.x.
Mravec J, Skupa P, Bailly A, Hoyerova K, Krecek P, Bielach A, Petrasek J, Zhang J, Gaykova V, Stierhof YD: Subcellular homeostasis of phytohormone auxin is mediated by the ER-localized PIN5 transporter. Nature. 2009, 459 (7250): 1136-1140. 10.1038/nature08066.
Finn RD, Clements J, Eddy SR: HMMER web server: interactive sequence similarity searching. Nucleic Acids Res. 2011, 39 (suppl 2): W29-W37.
Chen Q-J, Zhou H-M, Chen J, Wang X-C: Using a modified TA cloning method to create entry clones. Anal Biochem. 2006, 358 (1): 120-125. 10.1016/j.ab.2006.08.015.
von Heijne G: Membrane protein structure prediction. Hydrophobicity analysis and the positive-inside rule. J Mol Biol. 1992, 225 (2): 487-494. 10.1016/0022-2836(92)90934-C.
Librado P, Rozas J: DnaSP v5: a software for comprehensive analysis of DNA polymorphism data. Bioinformatics. 2009, 25 (11): 1451-1452. 10.1093/bioinformatics/btp187.
Hu R, Fan C, Li H, Zhang Q, Fu Y-F: Evaluation of putative reference genes for gene expression normalization in soybean by quantitative real-time RT-PCR. BMC Mol Biol. 2009, 10 (1): 93. 10.1186/1471-2199-10-93.
Ruijter JM, Ramakers C, Hoogaars WM, Karlen Y, Bakker O, van den Hoff MJ, Moorman AF: Amplification efficiency: linking baseline and bias in the analysis of quantitative PCR data. Nucleic Acids Res. 2009, 37 (6): e45. 10.1093/nar/gkp045.
Yoo S-D, Cho Y-H, Sheen J: Arabidopsis mesophyll protoplasts: a versatile cell system for transient gene expression analysis. Nat Protocols. 2007, 2 (7): 1565-1572. 10.1038/nprot.2007.199.
Bolte S, Talbot C, Boutte Y, Catrice O, Read N, Satiat-Jeunemaitre B: FM-dyes as experimental probes for dissecting vesicle trafficking in living plant cells. J Microsc. 2004, 214 (2): 159-173. 10.1111/j.0022-2720.2004.01348.x.
Acknowledgments
This work was partly supported by Transgenic program (2009ZX08009-133B), the Chinese National Key Basic Research Program “973” (2010CB125906), National High Technology Research and Development Program “863” (2013AA102602) and the National Natural Science Founds (31000680). Thank to Bengt L. Persson for yeast mutant PAM2, George Coupland for vectors of pEXSG-CFP-GW and pEXSG-YFP-GW, Long Mao for bioinformatics support, and Robert Koebner for language editing.
Author information
Affiliations
Corresponding author
Additional information
Competing interests
The authors declare that they have no competing interests.
Authors’ contributions
CF carried out all the analysis and interpreted the results, and wrote the manuscript. XW and RH participated in the data mining. YW and CX carried out RT-qPCR. YJ and XZ helped in soybean materials collection and total RNA extraction. YF and CZ conceived the project, supervised the analysis and critically revised the manuscript. All authors read and approved the final manuscript.
Electronic supplementary material
12870_2013_1257_MOESM5_ESM.xlsx
Additional file 5:A, The cis-acting regulatory DNA elements present within the 14GmPHT1promoters.B, ThePHT1gene family in M.truncatula and synteny blocks harbouringPHT1s among soybean and Medicago. C, Synteny betweenGmPHT1containing segments in soybean. D, Relative transcript abundance of the variousGmPHT1genes across different tissues. E, The information of the set ofGmPHT1genes and the primer sequences used for RT-qPCR and gene cloning experiments. F, The Ks and Ka values amongGmPHT1genes. (XLSX 194 KB)
12870_2013_1257_MOESM6_ESM.pdf
Additional file 6: The growth of the yeast double mutant PAM2 in the presence of various concentrations of Pi.(PDF 133 KB)
12870_2013_1257_MOESM7_ESM.pdf
额外的文件7:瞬态转录的GmPHT1;1-YFP, GmPHT1;5-YFP and GmPHT1;6-YFP fusions in plasmolyzed onion epidermal cells.(PDF 226 KB)
12870_2013_1257_MOESM9_ESM.pdf
额外的文件9:大豆根部的外观in plants subjected to different Pi concentration conditions.(PDF 285 KB)
Authors’ original submitted files for images
Below are the links to the authors’ original submitted files for images.
Rights and permissions
Open AccessThis article is published under license to BioMed Central Ltd. This is an Open Access article is distributed under the terms of the Creative Commons Attribution License (https://creativecommons.org/licenses/by/2.0), which permits unrestricted use, distribution, and reproduction in any medium, provided the original work is properly cited.
About this article
Cite this article
Fan, C., Wang, X., Hu, R.et al.The pattern ofPhosphate transporter 1genes evolutionary divergence inGlycine maxL..BMC Plant Biol13,48 (2013). https://doi.org/10.1186/1471-2229-13-48
Received:
Accepted:
Published:
DOI:https://doi.org/10.1186/1471-2229-13-48
Keywords
- Phosphate transporter 1
- Gene duplication
- Gene divergence
- Phosphorus homeostasis
- Evolution
- Glycine maxL.

