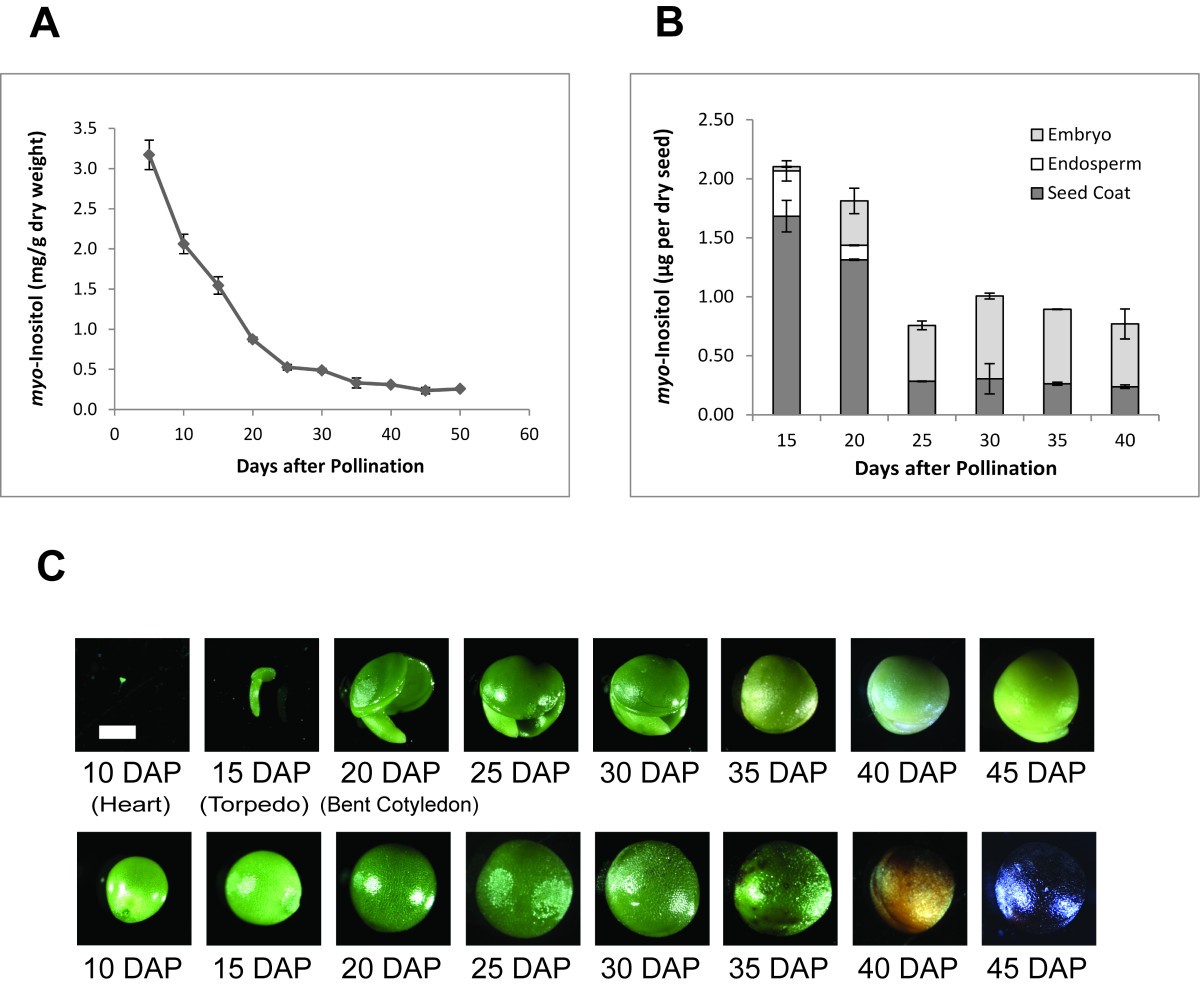
Figure 3

Analysis ofmyo-Inositol in whole and dissected seed at different developmental stages.(A) Declining levels ofmyo-Inositol (Ins) duringB. napusseed development expressed as Ins content of whole seed. Ins was analyzed in Westar seed at different developmental stages from 5 to 50 days after pollination (DAP). Each data point represents mean value of three biological replicates ±SE (standard error). (B)myo-Inositol distribution in different tissues of developing seed. Ins was measured in seed coat, endosperm and embryo at different developing stages. Data represent the amount of Ins distributed in seed coat (dark grey column), endosperm (white column) and embryo (light grey column) of one single seed. Each data point represents mean value of three biological replicates ±SE (standard error). (C) Relative sizes of the developing embryo (top row) relative to seed coat (bottom row) at various stages of seed development. The white bar represents the length of 1 mm.
