Figure 5
From:比较of ESTs from juvenile and adult phases of the giant unicellular green algaAcetabularia acetabulum

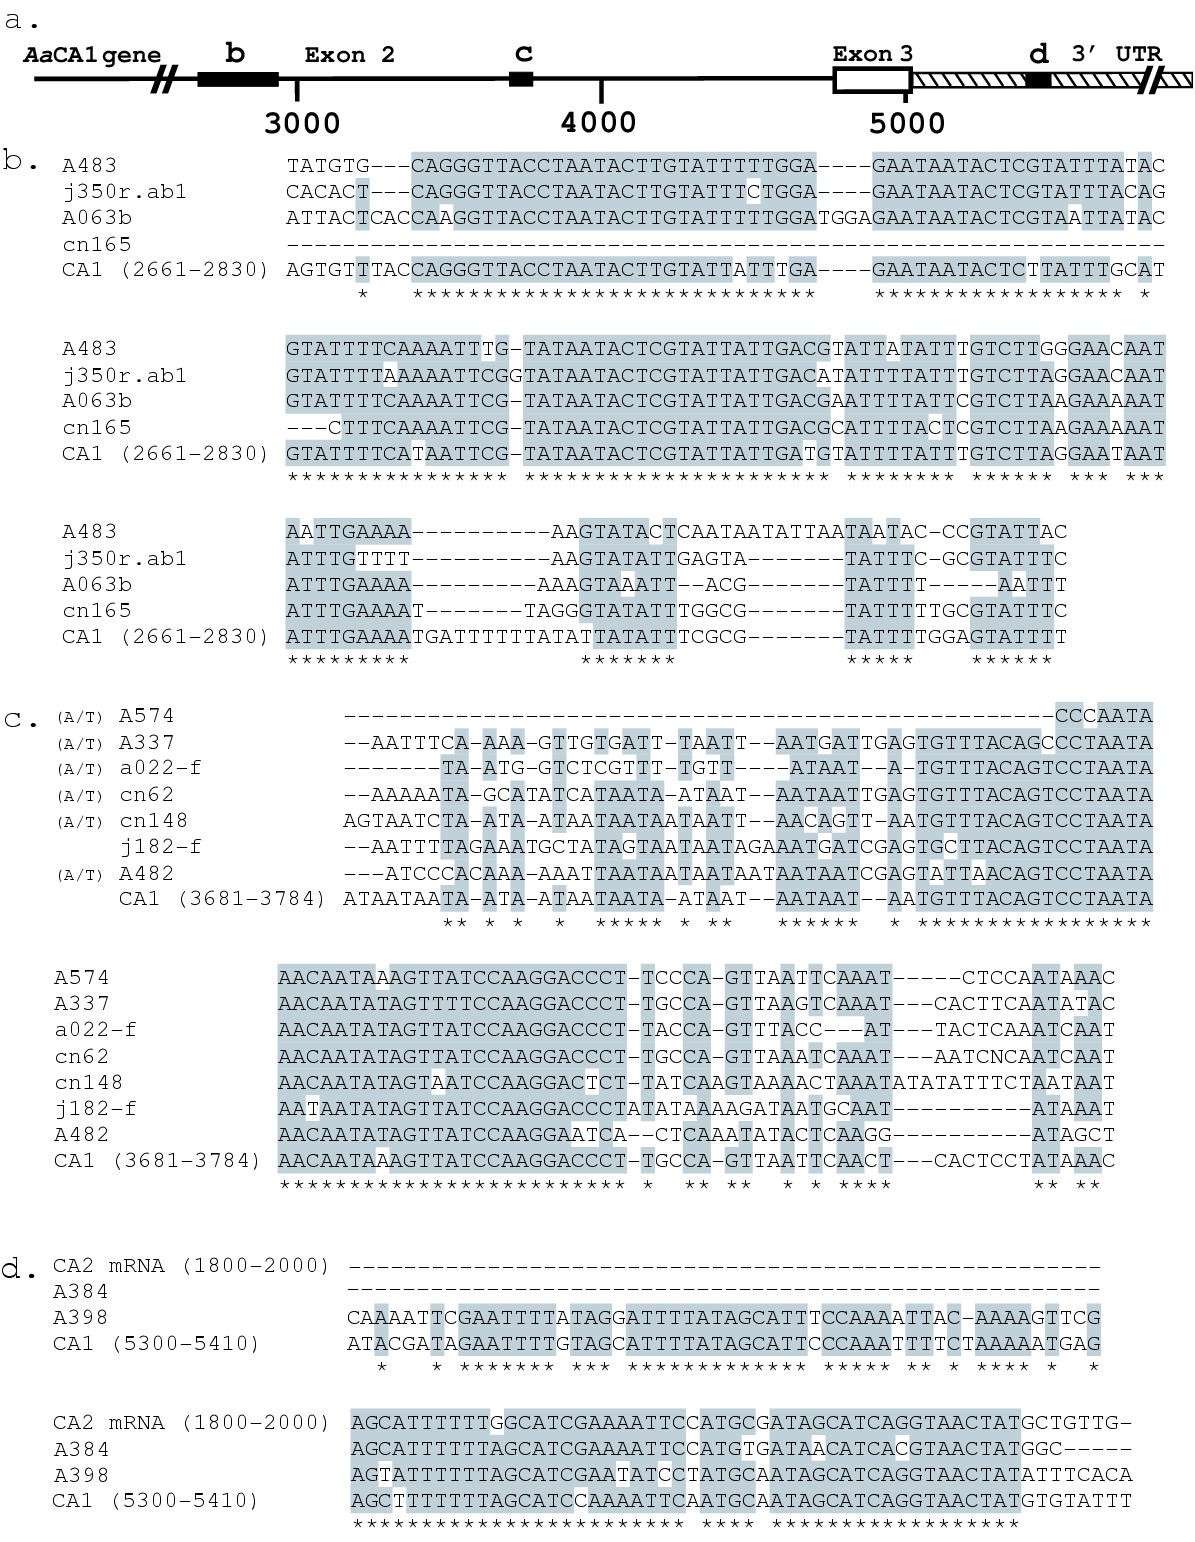
Conserved sequences among independent ESTs and their position relative to theA. acetabulumcarbonic anhydrase (AaCA1) genomic sequence. a: Structure of theAaCA1genomic sequence. Positions in the intron and 3'UTR where sequence was omitted are indicated by slanted, heavy double lines. The white boxes representAaCA1exons, the hatched box represents the 3' UTRs. The black boxes represent three regions of strong homology between different EST sequences and theAaCA1gene and theAaCA2mRNA. b, c and d: sequence alignments of theAaCA1gene and different ESTs (singletons or clusters) over these three conserved regions. The name of the EST or gene from which each sequence originates is indicated in front of the sequence. The regions of theAaCA1andAaCA2genes shown in the alignment are indicated in parentheses. * indicates a consensus in at least 70% of the sequences aligned. - indicates a gap in the alignment. The presence of a polyA/T tract at the end of an EST is indicated by "(A/T)" in front of the EST name.
