Figure 7
From:通用电气neration and analysis of 9792 EST sequences from cold acclimated oat,Avena sativa

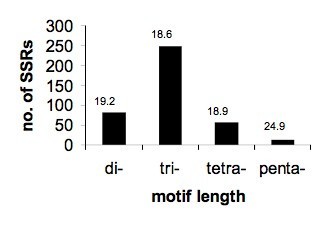
Microsatellite distribution. SSRs were sorted according to repeat motif length. The height of the bar indicates the number of SSRs that were found for each class. Numbers above bars denote average total SSR length.
