Figure 5
From:Characterization ofTM8, a MADS-box gene expressed in tomato flowers

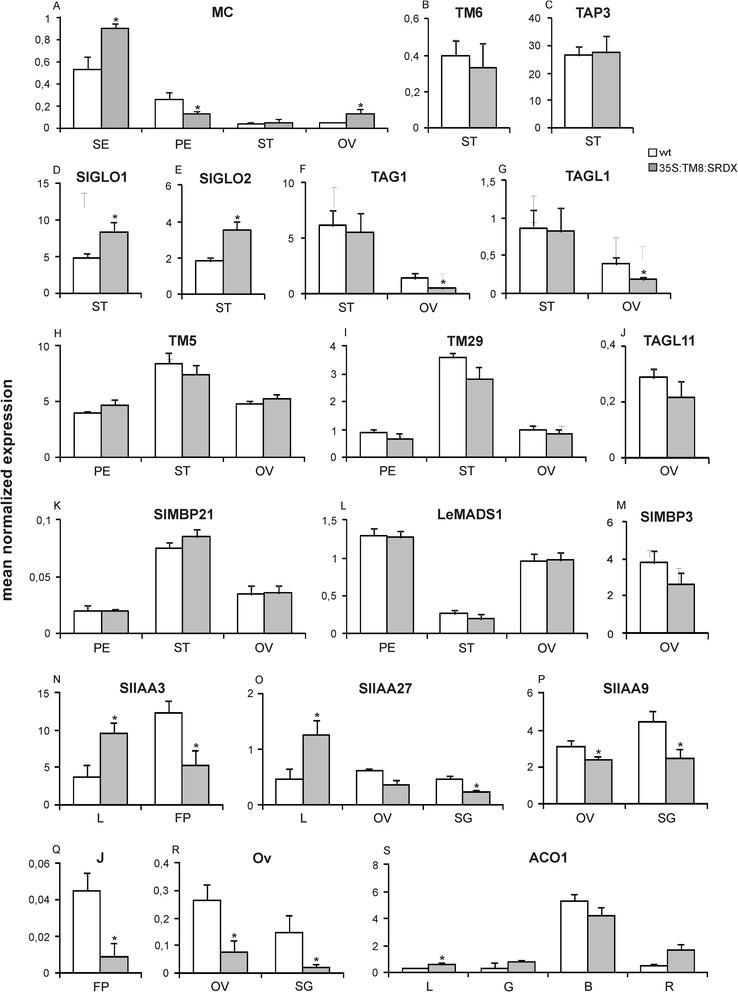
Relative expression of transcription factor encoding genes in35S:TM8plants.Relative expression of different genes in wild-type (white) andTM8:SRDXover-expressing (grey) tissues: sepals (SE), petals (PE), stamens (ST), ovaries (OV), flower peduncles (FP), leaf (L), and fruits at different stages of development [small green (SG), mature green (G), breaker (B) and red (R)]. Panels fromAtoMshow the expression of MADS-box transcription factor encoding genes and each panel incorporates the name of the examined gene. Panels fromNtoOshow the expression of genes coding for different Aux/IAA proteins whose specific name is reported in its dedicated panel. Finally, panelQ,RandSshow the expression of theJOINTLESS(J),OVATE(OV) andACO1genes, respectively. Expression data (means of the normalized expression) were obtained by real-time PCR analyses. Values represent the mean of three different transgenic lines and two untransformed plants. Bars are the standard deviations from the means. Asterisks indicate values significantly different by Student’s t test from the control (P <0.05).
