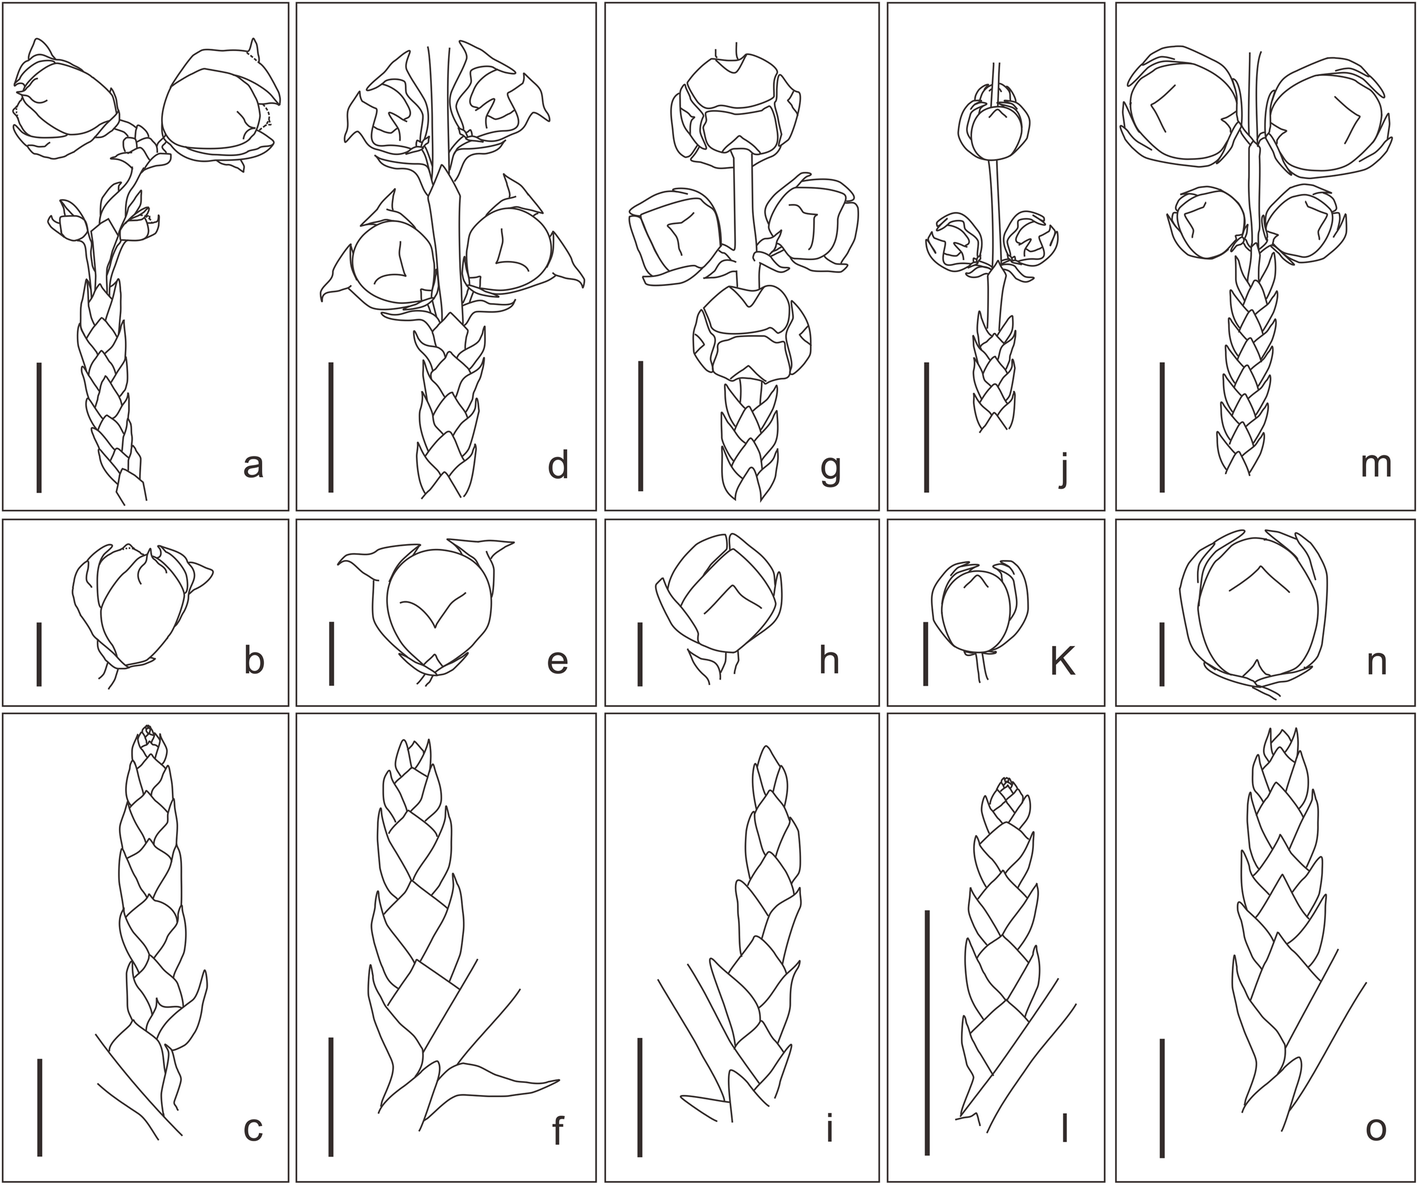
Fig. 2
From:Fossil evidence reveals how plants responded to cooling during the Cretaceous-Paleogene transition

Line drawing of all 5 species ofMesocyparis. (a), (b) & (c)M. sinica(this paper); (d), (e) & (f)M. borealis(redrawn from [18]); (g), (h) & (i)M. umbonata(redrawn from [22]); (j), (k) & (l)M. beringiana(redrawn from [20,22]); (m), (n) & (o)M. rosanovii(redrawn from [21]). (a), (d), (g), (j) & (m) fertile shoot ofMesocyparis, scale bar = 1 cm; (b), (e), (h), (k) & (n) seed cones ofMesocyparis, scale bar = 2 mm; (c), (f), (i), (l) & (o) branchlets in vegetative shoots ofMesocyparis, scale bar = 5 mm
