- Research article
- Open Access
- Published:
Genome-wide identification of theamino acid permeasegenes and molecular characterization of their transcriptional responses to various nutrient stresses in allotetraploid rapeseed
BMC Plant Biologyvolume20, Article number:151(2020)
Abstract
Background
Nitrogen (N), referred to as a “life element”, is a macronutrient essential for optimal plant growth and yield production.Amino acid (AA) permease(AAP) genes play pivotal roles in root import, long-distance translocation, remobilization of organic amide-N from source organs to sinks, and other environmental stress responses. However, few systematic analyses ofAAPshave been reported inBrassica napusso far.
Results
In this study, we identified a total of 34 full-lengthAAPgenes representing eight subgroups (AAP1–8) from the allotetraploid rapeseed genome (AnAnCnCn, 2n = 4x = 38). Great differences in the homolog number among theBnaAAPsubgroups might indicate their significant differential roles in the growth and development of rapeseed plants. TheBnaAAPswere phylogenetically divided into three evolutionary clades, and the members in the same subgroups had similar physiochemical characteristics, gene/protein structures, and conserved AA transport motifs. Darwin’s evolutionary analysis suggested thatBnaAAPswere subjected to strong purifying selection pressure.Cis-element analysis showed potential differential transcriptional regulation ofAAPsbetween the model Arabidopsis andB. napus.Differential expression ofBnaAAPsunder nitrate limitation, ammonium excess, phosphate shortage, boron deficiency, cadmium toxicity, and salt stress conditions indicated their potential involvement in diverse nutrient stress responses.
Conclusions
The genome-wide identification ofBnaAAPswill provide a comprehensive insight into their family evolution and AAP-mediated AA transport under diverse abiotic stresses. The molecular characterization of coreAAPscan provide elite gene resources and contribute to the genetic improvement of crop stress resistance through the modulation of AA transport.
Background
Seed yield and protein content are largely reliant on abundant accumulation of nitrogen (N), which is a macronutrient indispensable for optimal plant growth and organ development [1]。Plants absorb mainly inorganic N nutrients in the form of nitrate (NO3−) and ammonium (NH4+), some of which are assimilated into amino acids (AAs) directly in the roots or were translocated to the shoots. In addition, plants can also directly transport AAs and other organic N compounds into roots in soils [2]。The development and metabolism of vegetative and reproductive organs require large numbers of AAs in the phloem. AAs derived from senescent leaves are the major N forms for seed N nutrients [3]。Therefore, efficient uptake and translocation of AAs are favorable for yield production, and also favorable for plant resistance against various stresses [4,5,6,7]。
More than 100 putative AA transporters (AATs), including the Amino acid–Polyamine–Choline (APC) transporter superfamily and the Usually Multiple Acids Move In and Out Transporters (UmamiT) family, have been characterized in the model Arabidopsis. The APC family can be further grouped into three categories: Amino Acid Permeases (AAPs), Lysine/Histidine-like Transporters (LHTs) and Proline, and Glycine Betaine Transporters (ProTs) [8,9,10]。Among these AATs, AAPs are considered to be a moderate-affinity system with broad substrate specificity. In plants, AAPs are also involved in various physiological processes, including AA uptake [11], phloem loading or xylem–phloem transfer [12], seed loading [13], and grain yield [14]。AAPs localized on the plasma membrane are involved in cellular H+-coupled intake of a broad range of AAs. A recent study has reported that the genetic manipulation ofAAPsimproves AA transport from sources to sinks, which further enhances plant N use efficiency (NUE) [15]。Each member of theAAPfamily shows a specific temporal and spatial expression pattern, which indicates the non-redundant roles ofAAPsin plants [11]。
In Arabidopsis, the AAP family contains eight protein members (AtAAP1–8) that generally transport neutral and acidic AAs with moderate affinity except that AtAAP3 and AtAAP5 also transport basic AAs [16]。AtAAP1/AtNAT2(neutral amino acid transporter 2) facilitates AA import into the embryo [17,18]。AtAAP8 contributes to the efficient uptake of AAs into the seed endosperm [19]。AtAAP3andAtAAP5may be involved in root AA absorption [11,20]。AtAAP2 and AtAAP6 are reported to function in the xylem-phloem transfer of AAs [21,22]。
The allotetraploidBrassica napus(AnAnCnCn, 2n = 4x = 38) is the second most important oleaginous crops worldwide, and it originates from spontaneous hybridization of the diploidBrassica rapa(ArAr, 2n = 2x = 20) andBrassica oleracea(CoCo, 2n = 2x = 18) [23,24,25]。B. napushas a relatively higher demand for mineral nutrients, particularly N, than grain crops to achieve optimal seed yield [26]。Indeed, despite its strong capacity of N import,B. napushas lower NUE than other major agriculture crops [27], which may be attributed to the fact that senescent leaves easily detach from rapeseed plants before N nutrients, specifically organic amide-N, have been fully remobilized to sink organs [28,29]。Therefore, improving the N remobilization efficiency in oilseed rape is important for NUE enhancement through molecular modulation of AA transporters, particularly AAPs.
However, few systematic analyses ofAAPsinB. napushave been available so far. In this study, we were aimed to (i) identify the genome-wideAAPgenes inB. napus, (ii) characterize the genomic characteristics and transcriptional responses of theAAPgene members to N stresses, including nitrate limitation and ammonium toxicity, and (iii) investigate the transcriptional responses ofAAPsto other nutrient stresses, including phosphate limitation, boron deficiency, cadmium toxicity, and salt stress. The genome-wide identification and molecular characterization of theAAPmembers indicated their evolutionary conservation and functional divergence between allotetraploid rapeseed and the model Arabidopsis. The global landscapes of theAAPsmight provide comprehensive insights into the AA import and translocation in allotetraploid rapeseed under diverse nutrient stresses.
Results
Genome-wide identification ofAAPgenes
To identify theAAPfamily members inBrassicaspecies, we used the AA sequences of AtAAPs to perform BLASTp queries against the genome databases ofB. rapa(‘Chiifu-401’),B. oleracea(‘TO1000’), andB. napus(‘Darmor-bzh’). The query results revealed great differences in theAAPhomolog number occurred during the evolutionary process ofBrassicaspecies (Table1). As shown in Table1,AAPshad eight members (AAP1-AAP8) in the modelA. thaliana, and each AAP member only had a single copy. A total of 19, 17, and 34AAPhomologs were identified inB. rapa,B. oleracea, andB. napus, respectively. It can be found that the number ofAAPsinB. napuswas similar to the sum ofAAPsin bothB. rapaandB. oleracea.Therefore, it could be concluded that most of theAAPswere retained during the alloploidy formation ofB. napus.InB. napus, the number ofAAPsvaried from one (BnaCn.AAP6) to nine (BnaAAP8s) with an average of more than four homologs for each member. The difference in theAAPnumber might suggest their differential expansion patterns ofBnaAAPsduring the allopolyploidy process ofB. napus.
Genomic distribution and gene expansion ofBnaAAPs
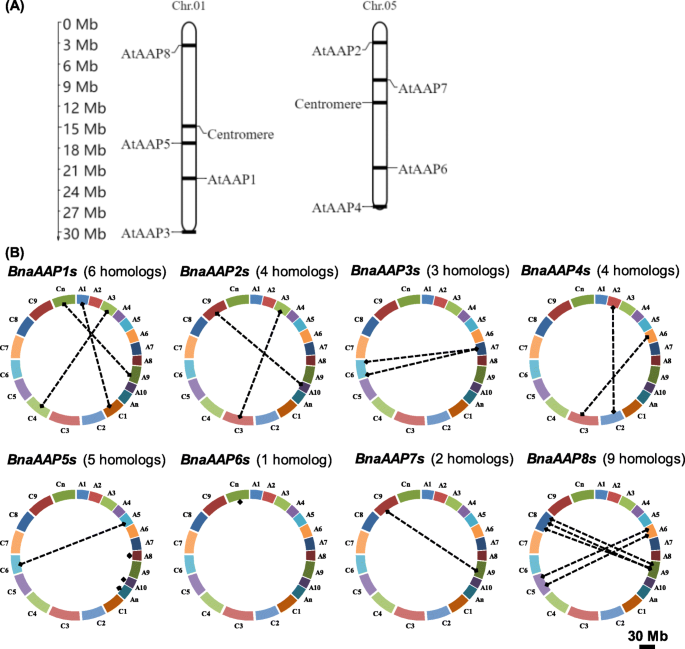
Through physical position identification, we found that eightAAPsin Arabidopsis showed strong preference for chromosomal distribution: four of them are located on the Chr. 01 (AtAAP1,AtAAP3,AtAAP5andAtAAP8) and the other four on Chr. 05 (AtAAP2,AtAAP4,AtAAP6andAtAAP7) (Table2, Fig.1a). To further explore the genomic distribution and gene expansion ofBnaAAPs, we retrieved the DNA sequences ofBnaAAPsin theBrassicaand CNS-Genoscope databases. Different from the intensive distribution ofAtAAPs, theBnaAAPswere physically scattered on 12 chromosomes (A subgenome: A1, A2, A3, A6, A7, A9, and A10; C subgenome: C1, C2, C3, C6, and C9) (Table2). In the A subgenome ofB. napus, Chromosome A9 exhibits the largest chromosome size and the second largest gene number according to the rapeseed genome annotation (http://www.genoscope.cns.fr/brassicanapus/). Our study showed that Chromosome A9 has the largestBnaAAPgene number, i.e. four, includingBnaA9。AAP1(BnaA09g14700D),BnaA9。AAP7(BnaA09g05130D),BnaA9。AAP8a(BnaA09g57230D), andBnaA9。AAP8b(BnaA09g57240D) (Table2). In the C subgenome, moreAAPswere identified on both Chromosome C6 and C8 than on the other seven chromosomes (C1-C5, C7, and C9). The homolog number of eightBnaAAPfamily genes varies from one to three, and they are relatively evenly distributed on different chromosomes (Table2).
Physical mapping and syntenic analysis of theamino acid permease(AAP) family genes inArabidopsis thalianaandBrassica napus.aGenomic position of the ArabidopsisAAPgenes (a) and their homologs inB. napus(b). TheBnaAAPhomologs between the An and Cn sub-genomes of rapeseed are connected by crashed lines. The length scale ofB. napuschromosomes (An subgenome: A1-A10; Cn subgenome: C1-C9) is 30.0 Mb
Gene family expands mainly via three pathways: tandem duplication, segmental duplication, and whole-genome duplication [30]。TheB. napusprogenitor diploids (B. rapaandB. oleracea) are ancient polyploids, and large-scale chromosomal rearrangements have occurred since their evolution fromAmborella trichopoda, a low chromosome number progenitor [31]。Comparative genomics reveals that the Arabidopsis genome is divided into 24 ancestral crucifer blocks, which are labeled A-X [32]。Table2shows that theAtAAPgenes and their corresponding homologs inB. napusare located in the same chromosomal blocks. To further understand the expansion patterns ofBnaAAPs, we investigated their duplication events. The results showed that theAAPfamily members inB. napuswere derived from the corresponding ancestors inB. rapaorB. oleracea, exceptBnaAAP8s, which expanded potentially through tandem duplication (Figs.1b and2). Based on the above result, we presumed that segmental duplication might be a main contributor to theBnaAAPfamily expansion.
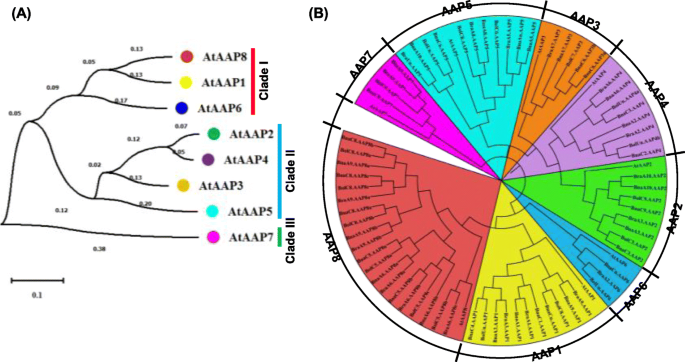
Phylogeny analysis of theamino acid permease(AAP)genes inArabidopsis thalianaandBrassicacrops.a-bPhylogeny analysis ofAtAAPs(a) and theAAPsinBrassicaspecies (b), includingA. thaliana,B. rapa,B. oleracea, andB. napus.The AAP protein sequences were multi-aligned using the ClustalW program, and then an unrooted phylogenetic tree was constructed using MEGA 6.06 with the neighbor-joining method. The percentages of replicate trees, in which the associated taxa clustered together in the bootstrap test (1000 replicates), are shown next to the branches. The tree is drawn to scale, with branch lengths in the same units as those of the evolutionary distances used to infer the phylogenetic tree. The evolutionary distances were computed with the Poisson correction method, and are in the units of the number of amino acid substitutions per site
Phylogeny analysis of BnaAAPs
To elucidate the molecular evolution and phylogenetic relationships among the AAP proteins, we constructed two unrooted phylogenetic trees involving AtAAPs and their homologs inBrassicaspecies (Fig.2). In Arabidopsis, according to the phylogeny relationships, we made the first attempt to classify the AAP family members into three major clades: Clade I (AtAAP1, AtAAP6, and AtAAP8), Clade II (AtAAP2, AtAAP3, AtAAP4, and AtAAP5), and Clade III (AtAAP7) (Fig.2a). Further, we performed a phylogeny analysis of 78 AAP proteins inA. thalianaand threeBrassicacrop species, includingB. rapa,B. oleracea, andB. napus.The phylogenetic tree was also subclassified into eight smallest categories, and the AAP members from different species were closely clustered with their corresponding homologs inA. thaliana(Fig.2b). What is noteworthy, theAAPgenes ofB. napuswere clustered into the smallest clades with their corresponding homologs in the diploid ancestorB. rapaorB. oleracea(Additional file: Figure S1). The result indicated that the AAP proteins divergence was prior to theBrassicaspeciation. We also observed that most of the AAP proteins within each subfamily had very short branch lengths (Fig.2b), suggesting a recent genetic divergence.
Molecular characterization of BnaAAPs
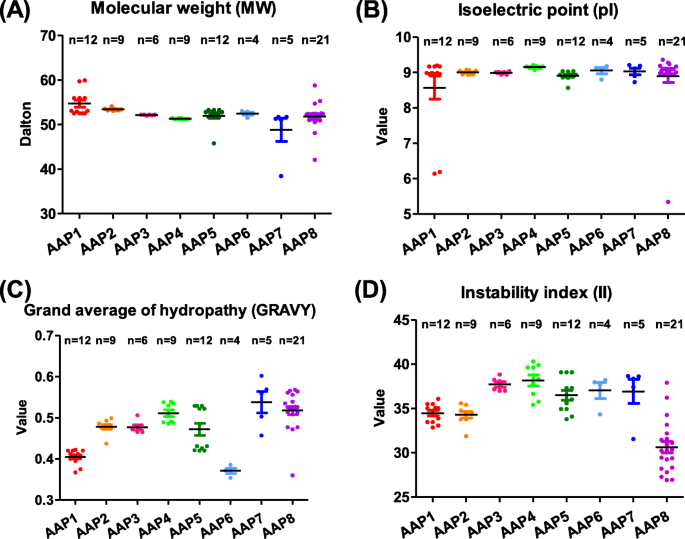
To understand the molecular characteristics of the BnaAAP proteins, we calculated the physicochemical parameters of each BnaAAP protein using ExPASy. The results showed that most proteins in the same AAP subfamily had similar parameters (Table2). In total, the coding sequence (CDS) lengths ofBnaAAPsvaried from 1059 bp (BnaC9.AAP7) to 1584 bp (BnaA9。AAP8b), corresponding to the variation of the deduced AA number from 352 to 527 (Table2). Most of the computed molecular weights (MWs) of the BnaAAP proteins ranged from 50.0 kD to 60.0 kD, except that those of BnaA10.AAP5 (45.8 kD) and BnaC9.AAP7 (38.4 kD) were smaller than 50.0 kD (Fig.3a, Additional file1: Table S1). The theoretical isoelectric points (pIs) of BnaAAPs varied from 6.19 (BnaA3.AAP1) to 9.28 (BnaA6.AAP8b), with most > 7.0 except that of BnaA3.AAP1 (6.19) (Fig.3b, Additional file1: Table S1). The grand average of hydropathy (GRAVY) value is calculated as the sum of hydropathy values of the AAs divided by the protein length. The results showed that the GRAVY values of the BnaAAP members ranged from 0.360 (BnaC8.AAP8a) to 0.566 (BnaC5.AAP8b) (Fig.3c, Additional file1: Table S1). Therefore, all the BnaAPPs were presumed to be hydrophobic. The instability indices (IIs) values of all the BnaAAPs were < 40.0 (Fig.3d, Additional file 1: Table S1), which showed strong protein stability. The online WoLF PSORT was used to predict the subcellular localization of eight AtAAPs and 34 BnaAAPs. The result indicated that they were localized in the plasma membrane, suggesting that they might be responsible for the trans-membrane transport of AAs. We used the TMHMM tool to characterize the transmembrane structures of AAPs inA. thalianaandB. napus, and found that AtAAPs and BnaAAPs had nine to ten membrane-spanning regions (Additional file1: Figure S2). In detail, the AtAAP5/BnaAAP5s, AtAAP6/BnaAAP6s, and AtAAP7/BnaAtAAP7s had ten transmembrane regions, and the other five subgroup members had nine membrane-spanning regions Additional file1: Figure S2). Similarly to the AtAAPs without signal peptides (Additional file1:图S3),观察BnaAPPs没有signal peptides, either. The Recombinant Protein Solubility Prediction (version 2009) indiated that the recombinant BnaAAPs would be insoluble when these proteins were overexpressed inE. coli.
Molecular characterization of the amino acid permease (AAP) proteins inBrassica napus.a-dMolecular weights (MWs,a), theoretical isoelectric points (pIs,b), grand average of hydropathy (GRAVY,c) values and instability indices (IIs,d) of the BnaAAP proteins. The GRAVY value is defined as the sum of hydropathy values of the amino acids divided by the protein length. An II value < 40.0 indicates that the protein is stable
Identification of evolutionary selection pressure onBnaAAPs
To characterize selection pressure on theBnaAAPsduring the evolutionary process, we used the orthologousAAPgene pairs betweenB. napusandA. thalianato determine the values of synonymous (Ks) and non-synonymous (Ka) nucleotide substitution rates, and Ka/Ks (Table2). The Ka values ofBnaAAPsranged from 0.0293 (BnaA3.AAP2) to 0.1508 (BnaC8.AAP8a) with an average of 0.05, and the Ks values ofBnaAAPsranged from 0.2216 (BnaA3.AAP2) to 0.5880 (BnaC8.AAP8a) with an average of 0.5199. Further, we found that all the Ka/Ks values ofBnaAAPswere < 1.0 (Table2). Therefore, we presumed that theBnaAAPsmight have experienced a very strong negative selection to preserve their function.
The Ks values of the duplicated homologs among gene families are usually presumed to be molecular clocks, and these Ks values are assumed to be constant over time. It has been reported that the segregation between the model Arabidopsis and its-derivedBrassicaplants occurred 12–20 million years ago (Mya) [33]。In this study, our results showed that most ofBnaAAPsmight diverge fromAtAAPsapproximately 12.0–18.0 Mya exceptBnaC8.AAP8a, implying that theBrassicaspeciation was accompanied by the divergence of theAAPgenes.
Conserved domain, exon-intron organization, gene interaction, and transcriptional regulatory analysis ofBnaAAPs
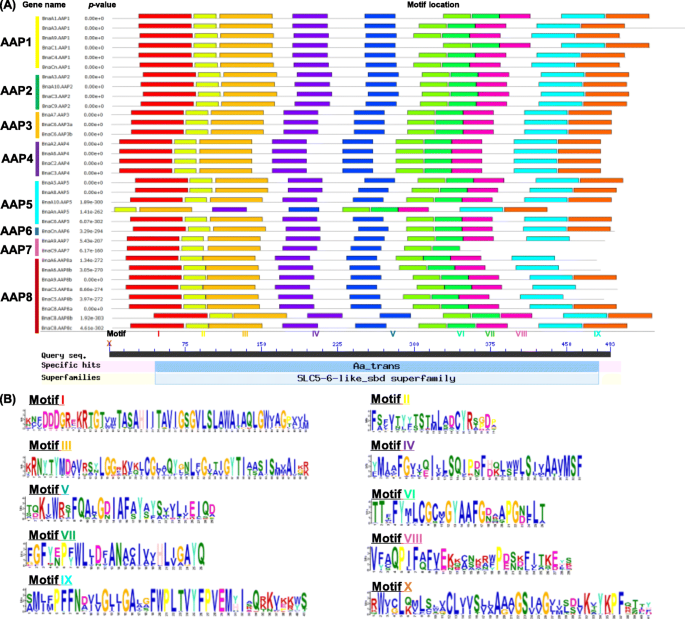
AA residues are thought to be functionally or structurally significant if they are evolutionarily conserved. The output of MEME showed that the eight BnaAAP subfamilies had conserved domains (Fig.4a). Further, we identified that these conserved domains belong to the amino acid transporter family, which is part of the solute carrier (SCL) superfamily proteins with solute binding domains (Fig.4a). Among the ten conserved domains we defined, the AA sequences of Motif I and IX exhibited the highest identity (Fig.4b), thereby which could be used as the identification indicators of the AAP family members.
Identification and characterization of the conserved motifs in the amino acid permease (AAP) proteins inArabidopsis thalianaandBrassica napus.Molecular identification (a) and sequence characterization (b) of the conserved motifs in the AAP proteins inA. thalianaandB. napus.Ina, the boxes with different colors indicate different conserved motifs (motif 1–15), and grey lines represent the AAP protein regions without detected motifs. Aa_trans indicates the amino acid transport regions; SCL5–6-like_sbd refers to the solute carrier (SCL) families 5 and 6-like proteins with solute binding domain (sbd). Inb, the larger the fonts, the more conserved the motifs
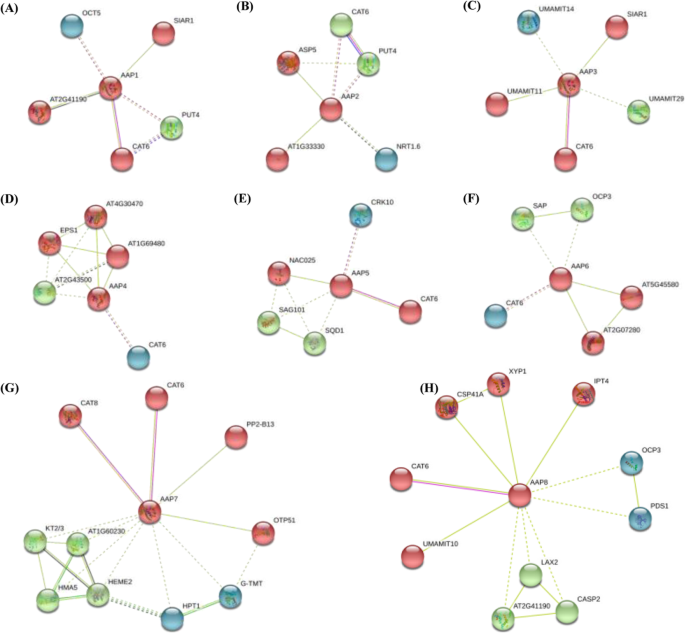
To further identify the protein(s) potentially interacting with the AAP family members, we constructed a protein interaction network involving direct (physical) and indirect (function) association by using the STRING database based on either known experimental or predicted interactions. As shown in Fig.5, all the AAP proteins consistently interacted with CAT6, a cation AA transporter (CAT) belonging to the AA polyamine choline (APC) family [34]。Besides, some other AA transporters, such as CAT8, SIAR1 (Silique Are Red 1), and the UMAMIT (Usually Multiple Acids Move In and out Transporters) family members, were also observed to interact with the AAP proteins (Fig.5).
Protein-protein interaction networks of the amino acid permease (AAP) proteins inBrassica napus.The interaction networks of the AAP1 (a), AAP2 (b), AAP3 (c) AAP4 (d), AAP5 (e), AAP6 (f), AAP7 (g) and AAP8 (h) and other proteins were constructed by the STRING web-server. Network nodes represent proteins. The network is clustered into three clusters, which are represented with red, green, and blue nodes, respectively. Colored nodes: query proteins and first shell of protein interactors; white nodes: the second shell of protein interactors. Empty nodes: proteins of unknown 3D structure; filled nodes: some 3D structure is known or predicted. Edges represent protein-protein associations
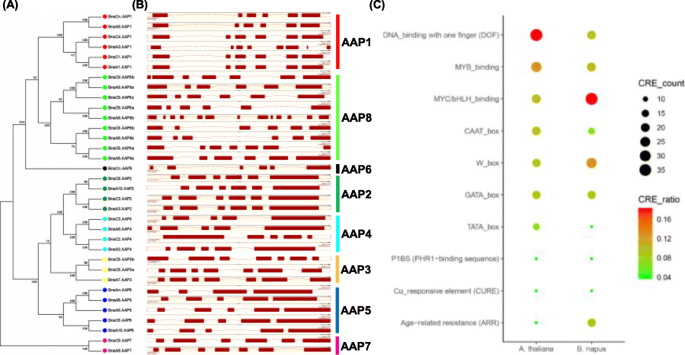
The exon-intron number and organization are indicative of evolutionary imprints within gene families. Considering this, we identified the gene structures ofBnaAAPsby comparing the genomic DNA sequences with their corresponding CDSs. As shown in Fig.6(a, b) and Table2, in general, mostAtAAPs had similar gene structures to their homologs inB. napus, which indicated their conserved functionality between the ancestor Arabidopsis andB. napus.However, we also observed some structure variations within aBnaAAPsubgroup (Table2). The exon/intron number variations, potentially caused by alternative splicing, might contribute to the functional differentiation of differentBnaAAPmembers.
Phylogeny relationship (a), exon-intron organizationb) of theamino acid permease(AAP) genes and enrichment analysis (c) of thecis-acting regulatory elements (CREs) in theAAPpromoter regions inBrassica napus.For eachAAP, a 2.0-kb genomic sequence in the upstream from the start codon (ATG) was downloaded from the TAIR (https://www.arabidopsis.org/) website andB. napusGenome Browser (http://www.genoscope.cns.fr/brassicanapus/) [24]。Subsequently, we submitted these sequences to the PLACE v. 30.0 (http://www.dna.affrc.go.jp/PLACE/) program [35] to identify putative CREs and calculate the CRE number along the 2.0 kb gene promoter region. In the scatter plot ofc, the larger the circle sizes, the more the corresponding CREs
Transcription factors (TFs), binding tocis-acting regulatory elements (CREs) in the promoters of their target genes, play important roles in the transcriptional regulation [36]。To identify the core TFs regulatingBnaAAPs, the 2.0-kb upstream sequences of theBnaAAPstart condons were used to explore the over-accumulated CREs (Fig.6). The results showed that all theBnaAAPfamily genes had various types of CREs in their promoter regions, which suggested that the complicated regulatory networks ofBnaAAPsmight be involved in their transcriptional regulation. Apart from the common CREs, such as the TATA box and the CAAT box, we also identified that three terms, namely, GATA-box, W-box (TGAC), and MYC/bHLH-binding elements were most highly enriched in theBnaAAPpromoter regions (Fig.6c). In both Arabidopsis andB. napus, the DNA-binding with one finger (Dof), MYB-binding, and MYC/bHLH-binding elements were highly enriched (Fig.6c). These results showed that on one hand, there Arabidopsis andB. napusshared the common regulatory mechanisms ofAAPs, on the other hand, these two species had their own specific regulatory mechanisms.
Transcriptional analysis ofBnaAAPs under diverse nutrient stresses
To identify the roles ofBnaAAPsin regulating rapeseed against various nutrient stresses, we examined their transcriptional responses under these circumstances. First, we investigated the transcriptional patterns ofAtAAPsin various tissues through the TAIR eFP Browser. The results showed that theAtAAP1,AtAAP2,AtAAP4,AtAAP5, andAtAAP6genes were highly expressed in cauline and senescent leaves (Additional file1: Figure S4A, B, D, E, and F), which indicated that these genes might play pivotal roles in the translocation of AAs from source leaves to sink organs. Furthermore, bothAtAAP3 andAtAAP8had the highest expression levels in the embryo seeds (Additional file1: Figure S4C and H), suggesting that they might be involved in seed development. The preferential expression ofAtAAP7in the second internodes (Additional file1: Figure S3G) suggested its participation in long-distance translocation of amide-N nutrients. The differential expression ofAAPsimplied their specific roles in plant growth and development.
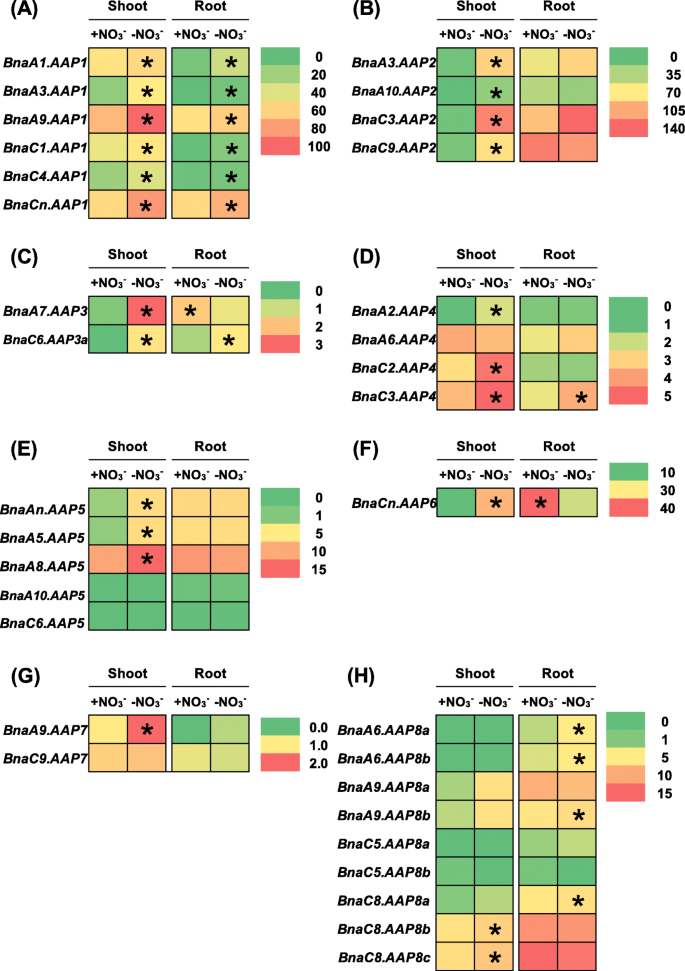
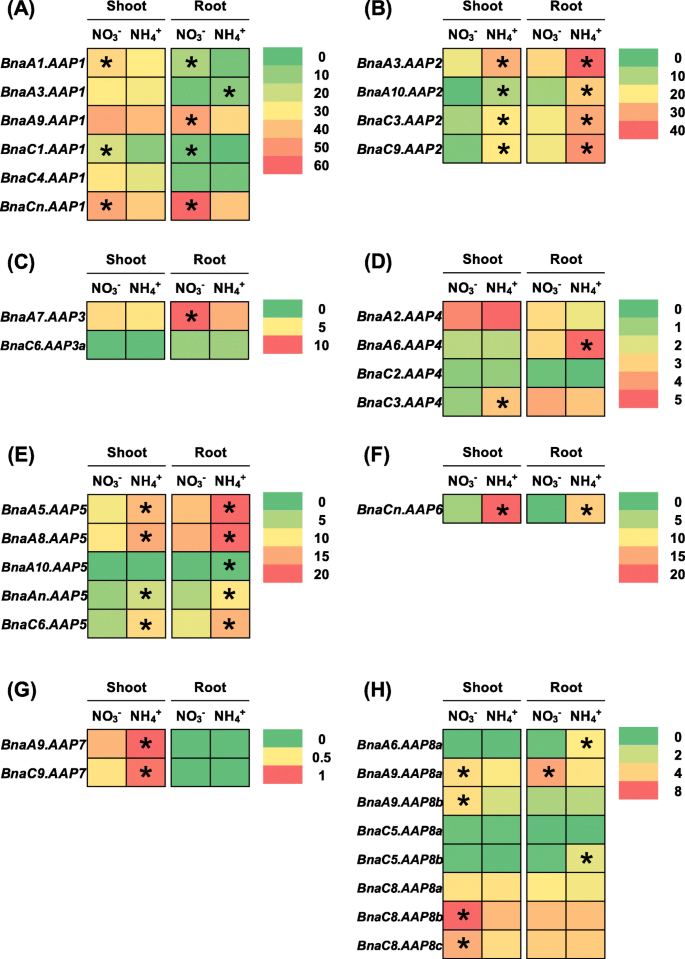
The above-mentioned results indicated that multiple copies of eachAAPhomolog occurred in allotetraploid rapeseed (Fig.1), and that transcriptional identification of the coreAAPmembers were very important for the in-depth understanding of theBnaAAPfunction. Rapeseed has a high demand for N nutrients whereas it shows very low NUE [26,27]。Under N stresses, the metabolic profiles of AAs were significantly altered in plants [37]。Under nitrate limitation condition, 26 members of 34BnaAAPswere differentially expressed in rapeseed plants compared with the condition of sufficient nitrate supply (Fig.7, Additional file1: Tables S2, S3). In detail, most of the differentially expressed genes (DEGs) were upregulated in the shoots or roots under nitrate deficiency except thatBnaA7.AAP3andBnaCn.AAP6were downregulated in the roots. It should be noted that among the eightBnaAAPsubfamilies, the expression of all theBnaAAP1swas consistently induced in both the shoots and roots (Fig.7a). Under ammonium toxicity, we identified a total of 26BnaAAPDEGs in the shoots and roots relative to the condition of nitrate sufficiency (Fig.8). In the shoots, we found that the DEGs of onlyBnaAAP1sandBnaAAP8sshowed higher expression levels under nitrate sufficiency than under ammonium toxicity (Fig.8a, h), and the DEGs of otherBnaAAPswere upregulated only when ammonium was supplied as the sole N nutrient source (Fig.8b-g). In the roots, the expression of most family members (BnaAAP2s,BnaAAP4s,BnaAAP5s,BnaAAP6s, andBnaAAP8s) was induced under ammonium toxicity (Fig.8b, d, e, f, h) whereas the differential expression profiling ofBnaAAP1s(exceptBnaA3.AAP1) andBnaAAP3spresented the opposite pattern (Fig.8a, c).
The qRT-PCR-assisted transcriptional characterization of theamino acid permease(AAP) genes inBrassica napusunder different nitrate (NO3−) supply levels. Differential expression of theBnaAAP1(a),BnaAAP2(b),BnaAAP3(c),BnaAAP4(d),BnaAAP5(e),BnaAAP6(f),BnaAAP7(g) andBnaAAP8(h) genes under high and low nitrate conditions. For the transcriptional analysis, the 7-d-old uniformB. napusseedlings after seed germination were cultivated under high (+, 6.0 mM) nitrate for 10 d, and then were transferred to low (−, 0.30 mM) nitrate for 3 d until sampling. The shoots and roots were individually sampled, and each sample includes three independent biological replicates. The significance level ofP < 0.05 is used as the threshold to identify the differential expression ofBnaAAPsunder high and low nitrate treatments. The differentially expressed genes with higher expression between different treatments in the shoots or roots are indicated with asterisks
The qRT-PCR-assisted transcriptional characterization of theamino acid permease(AAP) genes inBrassica napusunder different nitrogen (N) form conditions. Differential expression of theBnaAAP1(a),BnaAAP2(b),BnaAAP3(c),BnaAAP4(d),BnaAAP5(e),BnaAAP6(f),BnaAAP7(g) andBnaAAP8(h) genes under nitrate (NO3−) and ammonium (NH4+) conditions. For the transcriptional analysis, the rapeseed seedlings were first hydroponically cultivated under 6.0 mM nitrate (NO3−) for 10 d, and then were transferred to an N-free solution for 3 d. Subsequently, the above seedlings were sampled after treatment with 6.0 mM ammonium (NH4+) for 3 d. The shoots and roots were individually sampled, and each sample includes three independent biological replicates. The significance level ofP < 0.05 is used as the threshold to identify the differentialBnaAAPexpression under high and low nitrate treatments. The differentially expressed genes with higher expression between different treatments in the shoots or roots are indicated with asterisks
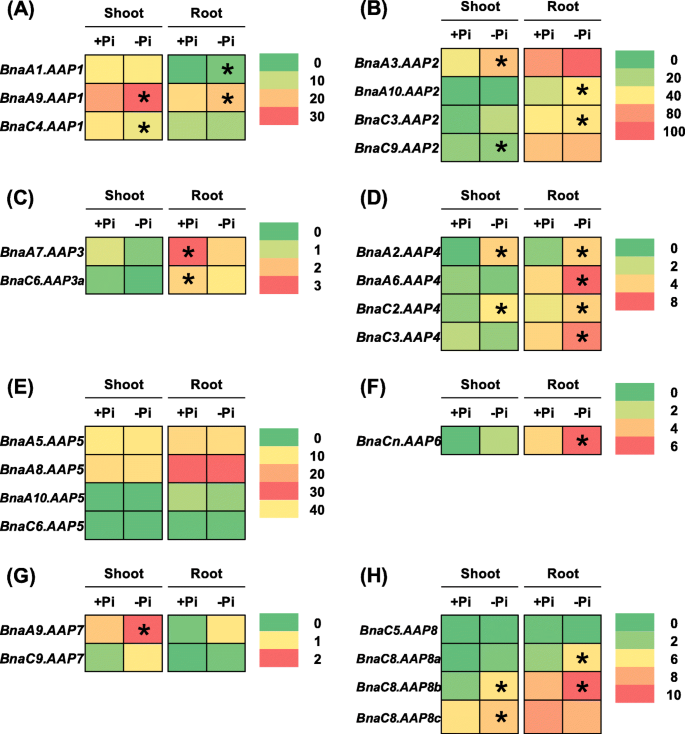
Phosphorus is one of the mineral nutrients required for plant growth, and it is widely used as fertilizers in agricultural production. Hu et al. [38] found that phosphate availability modulates the expression of nitrate-responsive genes, and that the NRT1.1B-SPX4 module is possibly involved in phosphate-regulated nitrate response, which indicates the interaction between N and phosphorus nutrients. Under phosphate limitation condition, a total of 15BnaAAPDEGs were identified in the shoots or roots (Fig.9, Additional file1: Table S2). In the shoots, no differential expression ofBnaAAP5sandBnaAAP6swas observed between sufficient phosphate and insufficient phosphate conditions (Fig.9e, f). However, the DEGs of otherBnaAAPswere upregulated by limited phosphate (Fig.9a-d, g-h). In the roots, 13BnaAAPsexhibited differential expression, however, we did not identify the differential expression ofBnaAAP5sandBnaAAP7sbetween sufficient phosphate and insufficient phosphate conditions (Fig.9e, g). The DEGs ofBnaAAP1s,BnaAAP2s,BnaAAP4s,BnaAAP6s, andBnaAAP8spresented higher expression levels under phosphate insufficiency than under phosphate sufficiency condition (Fig.9a, b, d, f, h). By contrast, insufficient phosphate supply repressed the expression ofBnaAAP3sin the roots (Fig.9c).
The qRT-PCR-assisted transcriptional characterization of theamino acid permease(AAP) genes inBrassica napusunder different phosphate (Pi) levels. Differential expression of theBnaAAP1(a),BnaAAP2(b),BnaAAP3(c),BnaAAP4(d),BnaAAP5(e),BnaAAP6(f),BnaAAP7(g) andBnaAAP8(h) genes under high (+, 250 μM) phosphate and low (−, 5 μM) phosphate levels. For the transcriptional analysis, the 7-d-old uniformB. napusseedlings after seed germination were first hydroponically grown under 250 μM phosphate (KH2PO4) 10 d,然后被转移到5μM磷酸盐phate for 3 d until sampling. The shoots and roots were individually sampled, and each sample includes three independent biological replicates. The significance level ofP < 0.05 is used as the threshold to identify the differentialBnaAAPexpression under high and low phosphate treatments. The differentially expressed genes with higher expression between different treatments in the shoots or roots are indicated with asterisks
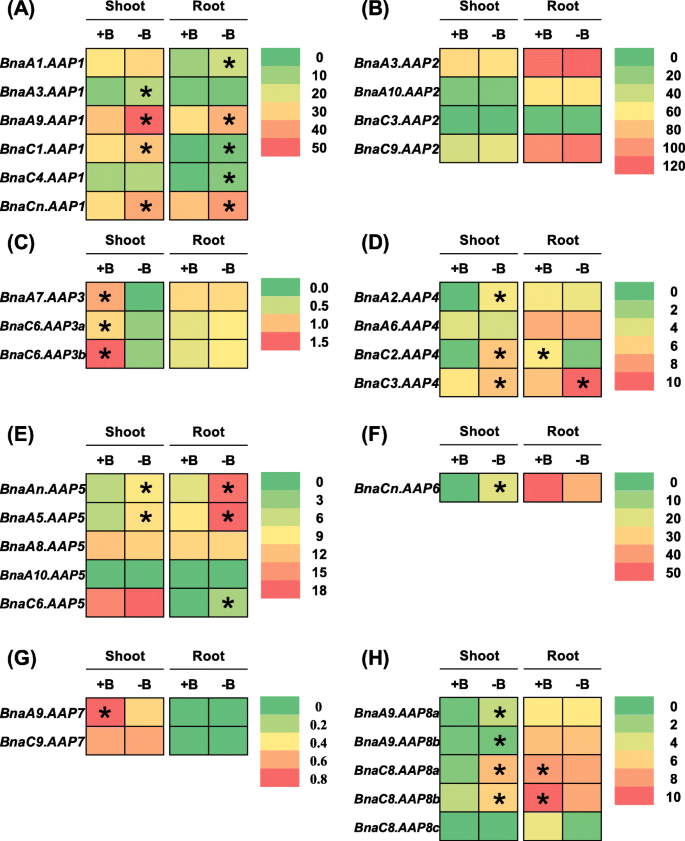
Boron is an essential micronutrient for vegetative and reproductive growth in plants [39], and our previous studies reveal thatB. napusis hypersensitive to boron deficiency [40,41]。In rapeseed plants, Wang et al. [42德]发现,硼剥夺提高蛋白质gradation and influences AA metabolism. Gas chromatography-mass spectrometry (GC-MS)-based metabolomics reveals that AA accumulation is increased in boron-deficient citrus [43]。Under deficient boron condition, we identified a total of 21BnaAAPDEGs in the shoots and roots (Fig.10a, c-h, Additional file1: Table S2) whereas we did not detect any differential expression ofBnaAAP2s(Fig.10b, Additional file1: Table S2). In the shoots, the expression of theBnaAAP1,BnaAAP4,BnaAAP5,BnaAAP6, andBnaAAP8度被defici硼显著调节ency whereas theBnaAAP3andBnaAAP7DEGs showed the opposite expression patterns (Fig.10c, g; Additional file1: Table S2). In the roots, we found that the low boron significantly induced the expression of theBnaAAP1,BnaC3.AAP4, andBnaAAP5DEGs (Fig.10a, e; Additional file1: Table S2), whereas repressed the expression of theBnaC2.AAP4andBnaAAP8DEGs (Fig.10d, h; Additional file1: Table S2).
The qRT-PCR-assisted transcriptional characterization of theamino acid permease(AAP) genes inBrassica napusunder different boron (B) levels. Differential expression of theBnaAAP1(a),BnaAAP2(b),BnaAAP3(c),BnaAAP4(d),BnaAAP5(e),BnaAAP6(f),BnaAAP7(g) andBnaAAP8(g) genes under high (+, 25 μM) and low (−, 0.25 μM) boron supply levels. For the transcriptional analysis, the 7-d-old uniformB. napusseedlings after seed germination were first hydroponically grown under 10 μM H3BO3for 10 d, and then were transferred to 0.25 μM H3BO3for 3 d until sampling. The shoots and roots were individually sampled, and each sample includes three independent biological replicates. The significance level ofP < 0.05 is used as the threshold to identify the differentialBnaAAPexpression under high and low boron treatments. The differentially expressed genes with higher expression between different treatments in the shoots or roots are indicated with asterisks
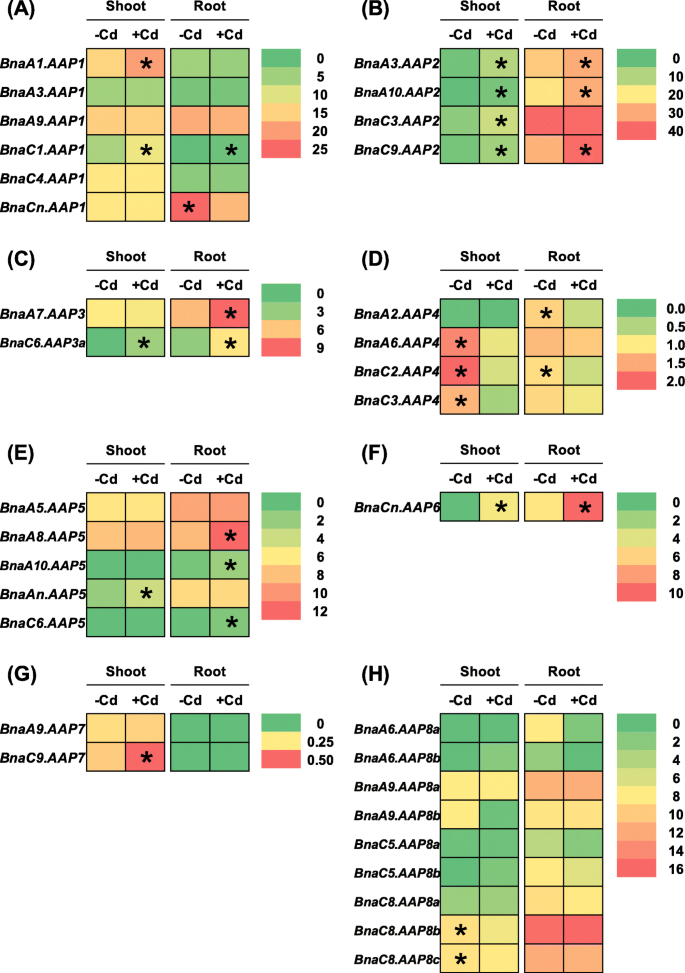
Cadmium is a non-essential heavy metal that is highly biotoxic for the growth and development of plant species [44]。Rapeseed has great potential for the phytoremediation of cadmium-contaminated soils [45]。Plants exhibit higher concentrations of AAs under cadmium toxicity than under cadmium-free conditions [46]。The increase in AA concentrations under cadmium stresses may be associated with their possible integration into phytochelatins, which serve as metal chelators to alleviate cell damages induced by cadmium toxicity [47,48]。Under cadmium toxicity, we identified a total of 21BnaAAPDEGs in the shoots and roots (Fig.11, Additional file1: Table S2). In the shoots, the expression of theBnaAAP1,BnaAAP2,BnaAAP3,BnaAAP5,BnaAAP6, andBnaAAP7DEGs was significantly elevated under cadmium toxicity (Fig.11a-c, e-g), which repressed the expression ofBnaAAP4sandBnaAAP8s(Fig.11d, h). In the roots, the expression of mostBnaAAPswas significantly upregulated by cadmium toxicity except that theBnaCn.AAP1expression was obviously downregulated by cadmium toxicity.
The qRT-PCR-assisted transcriptional characterization of theamino acid permease(AAP) genes inBrassica napusunder cadmium (Cd) toxicity. Differential expression of theBnaAAP1(a),BnaAAP2(b),BnaAAP3(c),BnaAAP4(d),BnaAAP5(e),BnaAAP6(f),BnaAAP7(g) andBnaAAP8(h) genes under Cd-free (−Cd) and Cd (10 μM CdCl2) toxicity. For the transcriptional analysis, the 7-d-old uniformB. napusseedlings after seed germination were hydroponically cultivated in a cadmium-free solution for 10 d, and then were transferred to 10 μM CdCl2for 12 h until sampling. The shoots and roots were individually sampled, and each sample includes three independent biological replicates. The significance level ofP < 0.05 is used as the threshold to identify the differentialBnaAAP本文表达下一直和镉ts. The differentially expressed genes with higher expression between different treatments in the shoots or roots are indicated with asterisks
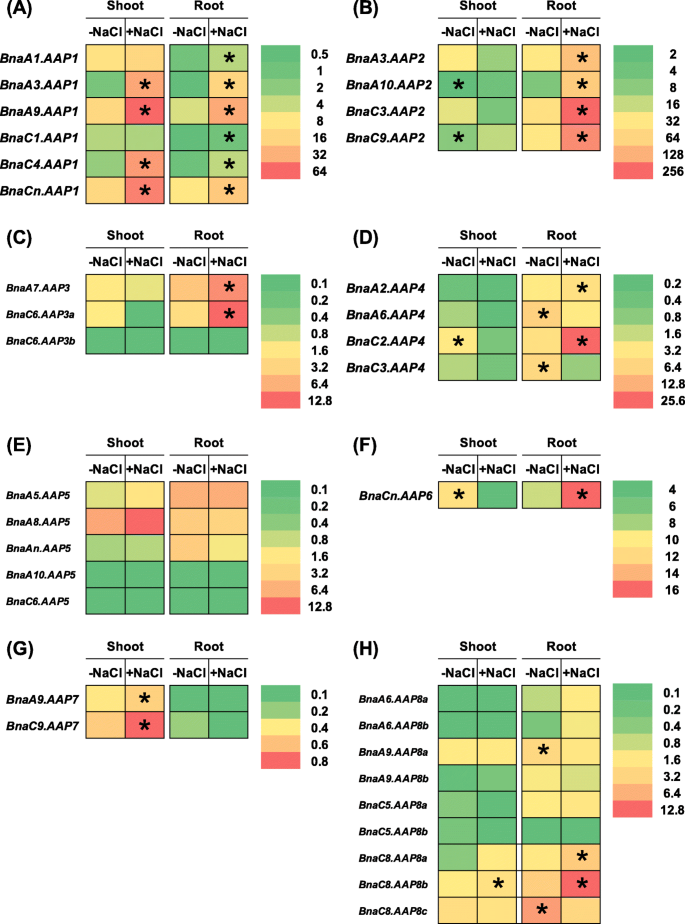
Soil salinity is one of the most important environmental factors that constrain plant growth, and development, and salt stress significantly reduces rapeseed yield [49]。Salt stress induces an obvious increase in AA concentrations [50], and the enhancedAAPexpression promotes plant salt tolerance [51]。Under salt stress, we identified a total of 23AAP度在芽和根。的八AAPsubgroups, we did not detect differential expression ofBnaAAP5s(Fig.12). Most of the DEGs, particularlyBnaAAP1sandBnaAAP2s, showed higher expression levels under salt stress than under the non-salt condition (Fig.12).
The qRT-PCR-assisted transcriptional characterization of theamino acid permease(AAP) genes inBrassica napusunder cadmium (Cd) toxicity. Differential expression of theBnaAAP1(a),BnaAAP2(b),BnaAAP3(c),BnaAAP4(d),BnaAAP5(e),BnaAAP6(f),BnaAAP7(g) andBnaAAP8(h) genes under NaCl-free (−NaCl) and salt (+NaCl, 200 mM NaCl) treatments. For the transcriptional analysis, the 7-d-old uniformB. napusseedlings after seed germination were hydroponically cultivated in a NaCl-free solution for 10 d, and then were transferred to 200 mM NaCl for 12 h. The shoots and roots were individually sampled, and each sample includes three independent biological replicates. The significance level ofP < 0.05 is used as the threshold to identify the differentialBnaAAP本文表达下一直和镉ts. The differentially expressed genes with higher expression between different treatments in the shoots or roots are indicated with asterisks
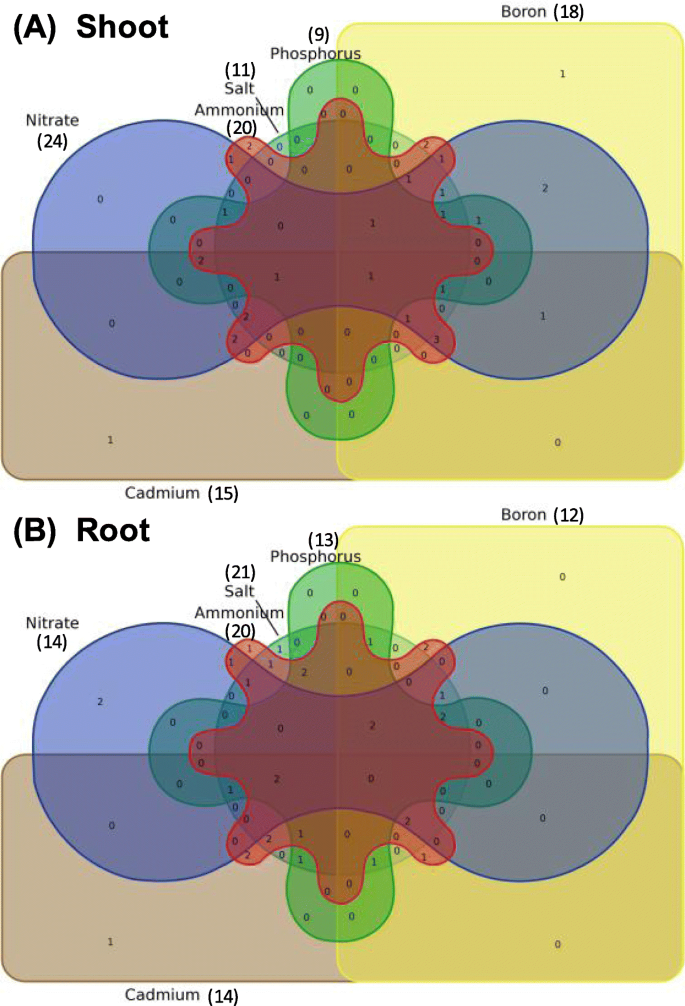
To investigate whetherBnaAAPswere responsive to diverse nutrient stresses simultaneously, we constructed a Venn diagram with the identified DEGs. As shown in Fig.13,BnaC8.AAP8bwas simultaneously regulated by low nitrate, excessive ammonium, limited phosphate, deficient boron, toxic cadmium, and salt stress conditions in the shoots (Fig.13a). This result indicated thatBnaC8.AAP8bmight play a core role in regulating rapeseed resistance to nutrient stresses through the modulation of AA transport. Although we did not detect anyAAPhomolog simultaneously responsive to these six nutrient stresses in the rapeseed roots, we found severalAAPhomologs, such asBnaA1.AAP1sandBnaA9。AAP1, simultaneously responsive to three or four nutrient stresses (Fig.13b).
Discussion
Previous studies have shown that theAAPfamily members play critical roles in plant growth, organ development, and abiotic and biotic stress responses [4,5,6,7]。However, there have been few systematic studies onAAPsinB. napusso far. In this study, we identified a total of 34 full-lengthAAPhomologs representing eight subgroups (AAP1-AAP8) in the allotetraploid rapeseed genome (AnAnCnCn). We found some homolog number variations ofAAPsand analyzed their phylogeny relationships inBrassicaspecies. In addition, we also analyzed the physio-chemical characteristics, gene/protein structures, conserved AA transport motifs, Darwin’s evolutionary pressure, and CREs ofAAPsinB. napus.Eventually, we delineated the differential expression profile ofBnaAAPs under nitrate limitation, ammonium excess, phosphate shortage, boron deficiency, cadmium toxicity, and salt stress. The global landscapes ofBnaAAPswill provide an integrated insight into their family evolution and AAP-mediated AA transport.
Homolog number variations ofAAPsin allotetraploid rapeseed indicated their functional divergence
Our previous study has shown that the genes within a family usually exhibit obvious number variations during their evolutionary process [52], which further contributes to gene family division, expansion, and functional divergence [53]。B. napus, which is formed by hybridization of the diploidB. rapaandB. oleracea, undergoes several rounds of whole-genome triplication and duplication compared with Arabidopsis [24]。Therefore, these processes usually causes the formation of multicopy (four to six, or more) gene family in allotetraploid rapeseed [54]。In this study, we found that the homolog number variation events ofAAPsalso occurred in allotetraploid rapeseed (Fig.1b). In the model Arabidopsis, eachAAPhad a single copy (Fig.1a), however, the copy number ofBnaAAPsvaried from one (BnaAAP6) to nine (BnaAAP8s) (Fig.1b). The result indicated that there might exist the functional divergence of theBnaAAPhomologs.
Differential expression profiling ofBnaAAPsimplied their potential involvement in the responses of rapeseed plants to diverse nutrient stresses
Environmental stresses lead to AA accumulation in leaves due to the decrease in AA usage for protein biosynthesis or the increase in AA release from protein degradation [55]。AA组成的变化在细胞response to environmental stresses results in the expression alterations ofAATs[56]。
About 75% of the leaf N nutrients in the C3plants are stored in the form of chloroplast proteins [57], which are considered as the main sources for N reallocation within the plant shoots [58]。Under N deficiency, these chloroplast proteins in the old or senescent leaves are degraded into amide-N compounds, particularly AAs, which are reallocated into the newly developing leaves [10]。Therefore, optimal expression of theAAPgenes will contribute to the efficient transport of AAs, thus favoring the enhancement of crop N limitation adaptation and NUE.
A previous study determined the AA concentrations in all subcellular compartments and characterized theAAPfamily transporters. However, threeAAPgenes were identified and their expression profiling was characterized at different nitrate levels [59]。In another study, 8AAPfamilies (AAP1-AAP8) containing 18AAPmembers were identified in rapeseed, but they does not fully cover the genome-wideAAPhomologs [60]。Different from our present study, previous studies focused on theAAPexpression patterns during different growth and developmental stages ofB. napus.
In this study, we found that most of theBnaAAPfamily genes were upregulated in the shoots or roots under limited nitrate supply (Fig.7). We speculated that the enhanced expression ofBnaAAPsmight contribute to AA loading into the vascular tissues for long-distance translocation in the roots, and it might facilitate efficient transport of AAs from source leaves to sink organs in the shoots. Ammonium is a major inorganic N source for plants. At low external supplies, ammonium promotes plant growth, whereas at high external supplies it causes toxicity [61]。When plants are exposed to ammonium stresses, excessive ammonium can be involved in the biosynthesis of AAs mainly through the glutamine synthetase/glutamate synthase pathway, and then surplus ammonium or the newly synthesized AAs are translocated from roots to shoots [62]。In this study, we found that the expressions of someBnaAAPswere altered in response to ammonium toxicity (Fig.8), which indicated their potential involvement in the alleviation of excessive ammonium-induced damages in rapeseed plants.
In this study, we found that all of theBnaAAPDEGs were upregulated in both the shoots and roots under phosphate deficiency (Fig.9). It suggested that the phosphate deficiency might facilitate the efficient transport of AA, thus enhancing the adaptation of rapeseed plants to the phosphate-starvation environment. In this study, we found that most of the low boron stress-responsiveBnaAAPs, such asBnaAAP1sandBnaAAP4–6 s, were upregulated (Fig.10). Therefore, it could be concluded that limited boron supply might trigger AA import and translocation in rapeseed plants by enhancing theAATexpression. The majority of cadmium-responsiveBnaAAPs, exceptBnaAAP4sandBnaAAP8s, showed higher expression levels under cadmium toxicity than under the cadmium-free condition (Fig.11). Based on the aforementioned findings, we proposed that the enhanced expression ofBnaAAPsmight contribute to efficient AA transport, and it further facilitated the biosynthesis of cadmium-chelators, therefore enhancing plant cadmium resistance. In addition, we also found that salt stress led to a significant increase in the expression of mostBnaAAPsin both the shoots and roots (Fig.12), and might be associated with salt stress inducing an obvious increase in AA concentrations [50], which contributed to enhancing plant salt resistance [51]。
Take together, our above results showed thatBnaAAPswere responsive to diverse nutrient stresses, which implied the essential roles ofBnaAAPsin the resistance or adaptation of rapeseed plants to stresses.
EliteAAPscould be utilized to enhance crop resistance to biotic and abiotic stresses through genetic engineer
Antisense inhibition ofStAAP1expression in potato leaves reduces AA content in potato tubers [63]。The over-expression ofPsAAP1in pea plants contributes to seed AA accumulation and yield enhancement [64]。AAP1-mediated increased proline uptake enhances salt tolerance n Arabidopsis seedlings [51]。Genetic variation in Dip5, anAAPmember, regulates glyphosate resistance inSaccharomyces cerevisiae[65]。Knocking out the ArabidopsisAAP2leads to increased N allocation to photosynthetically active source leaves, independently of soil N availability to the plants [15]。ThePsAAP6function in root nodules affects both shoot and root N supply [6]。All these, theAAPfamily genes play pivotal roles in crop resistance to diverse stresses.
This study characterized global landscapes ofBnaAAPs,这将提供一个全面的理解of this family gene evolution and AAP-mediated AA transport. Our genome-wide identification and molecular characterization of the coreBnaAAPsmay provide elite gene resources and favor the genetic improvement of rapeseed resistance to nutrient stresses, such as nitrogen limitation, ammonium toxicity, phosphate deficiency, boron deficiency, cadmium toxicity and salt stress, through the molecular modulation ofAATs, particularlyAAPs.
Methods
Retrieval ofAAPgene sequences
Using the AA sequences of AAPs fromA. thalianaas sources, we conducted a BLASTp search for theAAPhomologs inB. rapa,B. oleraceaandB. napus.In this study, we retrieved theAAPgene sequences using the following databases: The Arabidopsis Information Resource (TAIR10,https://www.arabidopsis.org/) forA. thaliana,BrassicaDatabase (BRAD) v. 1.1 (http://brassicadb.org/brad/) forB. rapa[66波尔基地诉),1.0 (http://119.97.203.210/bolbase/index.html) forB. oleracea[67], Genoscope (http://www.genoscope.cns.fr/brassicanapus/) forB. napus[24], National Center for Biotechnology Information (NCBI,www.ncbi.nlm.nih.gov),EnsemblPlants(http://plants.ensembl.org/index.html), and Phytozome v. 10 (http://phytozome.jgi.doe.gov/pz/portal.html) [68]。
Gene nomenclature ofBnaAAPs
In this study, based on the nomenclature previously proposed [69,70,71], we named theAAPgenes inBrassicaspecies following the criterion: genus (one capital letter) + plant species (two lowercase letters) + chromosome (followed by a period) + name of theAAPhomologs inA. thaliana.For example,BnaA1.AAP1represents an ArabidopsisAAP1homolog on the chromosome A1 ofB. napus.
Physical mapping and gene expansion analysis ofBnaAAPs
We determined the genomic locations ofBnaAAPsby BLASTn search with the complete nucleotide sequences ofAtAAPs.Using the genomic annotation, we physically mapped theAtAAPsandBnaAAPsonto the chromosomes using the MapGene2Chromosome v2.1 (http://mg2c.iask.in/mg2c_v2.1/). In this study, we defined the tandem duplicated genes as an array of two or moreAAPgenes within a 100-kb genomic region.
Multiple sequence alignment and phylogeny analysis
We aligned the full-length sequences of the AAP proteins of Arabidopsis andB. napususing ClustalW [72] within MEGA (Molecular Evolutionary Genetics Analysis) v. 6.06 (http://www.megasoftware.net/) [73]。After these alignments, we constructed the phylogenetic trees with the neighbor-joining (NJ) method [74]。We set the Poisson correction, pairwise deletion, and bootstrapping (1000 replicates; random seeds) as the required parameters.
Analysis of evolutionary selection pressure and functional divergence ofBnaAAPs
To determine positive or negative (purifying) selection pressure onBnaAAPs, we calculated the values of Ks, Ka, and Ka/Ks. First, we performed pairwise alignment of theBnaAAP-AtAAPCDSs using Clustal Omega (http://www.clustal.org/omega/) [75]。Then, we submitted the readout to the KaKs_Calculator (https://sourceforge.net/projects/kakscalculator2/) software [76] for the calculation of the Ka, Ks, and Ka/Ks with the yn00 method [77]。According to the Darwin’s evolution theory, it is proposed that Ka/Ks > 1.0 means positive selection, while Ka/Ks < 1.0 indicates purifying selection, and Ka/Ks = 1.0 denotes neutral selection. Further, we calculated the divergence time ofBnaAAPsfrom their progenitors by the following formula:\( \mathsf{T}=\mathsf{Ks}/\mathsf{2}\lambda, \lambda =\mathsf{1.5}\times {\mathsf{10}}^{-\mathsf{8}}\mathsf{forBrassicaceaespecies} \)[78]。
Molecular characterization of BnaAAPs
To reveal the molecular characteristics of BnaAAPs, we used the ExPASy ProtoParam (http://www.expasy.org/tools/protparam.html) [79] program to determine the AA number and composition, MW, pI, GRAVY, and IIs. Values of II > 40.0 suggest that the proteins are unstable [35]。We used the online WoLF PSORT (http://www.genscript.com/wolf-psort.html) [80] program to predict the subcellular localization. To characterize the transmembrane helices of AtAAPs and BnaAAPs, we submitted their AA sequences to the TMHMM v. 2.0 (http://www.cbs.dtu.dk/services/TMHMM/) program.
We employed the online SignalP v. 4.1 (http://www.cbs.dtu.dk/services/SignalP/) [81] to predict the presence and location of signal peptide cleavage sites in the AA sequences of BnaAAPs. To determine the recombinant protein solubility, we used the RPSP v. 2009 (http://biotech.ou.edu) program, in which the AAP proteins are assumed to be overexpressed inE. coli[82]。
We used the STRING (Search Tool for Recurring Instances of Neighboring Genes) v 11.0 (https://string-db.org) [83] web-server to retrieve and display the repeatedly occurring association networks, including direct (physical) and indirect (function) association, of the AAP proteins inA. thalianaandB. napus.
Conserved motif/domain identification of BnaAAPs
We used the online InterProScan5 (http://www.ebi.ac.uk/interpro/search/sequence-search) and the conserved domain database (CDD) (http://www.ncbi.nlm.nih.gov/Structure/bwrpsb/bwrpsb.cgi) to determine the presence of the Aa_trans domain (PAFM01490) of the AAP proteins.
To further examine the structural divergence of the AAP proteins inA. thalianaandBrassicacrops, we submitted the protein sequences to the online MEME (Multiple Expectation maximization for Motif Elicitation) v. 4.12.0 (http://meme-suite.org/tools/meme) [84] for the characterization of conserved motifs/domains. We used all the default parameters except the following two parameters: the optimum motif width was set as 6–50 bp and the maximum number of motifs was set as 10. The conserved motif sequences were presented by the online Weblogo (https://weblogo.berkeley.edu/logo.cgi) [85]。
Elucidation of exon-intron structure and putative CREs in promoter regions ofBnaAAPs
Full-length genomic DNA (gDNA) and CDS sequences were collected from the annotated genomes ofA. thalianaandB. napus, and they were used to predict the exon-intron structure ofAAPgenes. For eachAAPgene, a 2.0-kb genomic sequence upstream from the start codon (ATG) was downloaded from the TAIR (https://www.arabidopsis.org/) website andB. napusGenome Browser (http://www.genoscope.cns.fr/brassicanapus/) [24]。Subsequently, we submitted these sequences to the PLACE v. 30.0 (http://www.dna.affrc.go.jp/PLACE/) program [86] to identify putative CREs.
Transcriptional analysis ofBnaAAPsunder diverse nutrient stresses
In this study, the expression patterns ofAtAAPswere obtained from the TAIR eFP Browser [87]。To further characterize the transcriptional responses ofBnaAAPsunder diverse nutrient stresses, we transplanted the 7-d-old uniformB. napusseedlings (Zhongshuang 11) after seed germination into black plastic containers with 10 L Hoagland nutrient solution. The basic nutrition solution contained 1.0 mM KH2PO4, 5.0 mM KNO3, 5.0 mM Ca(NO3)2·4H2O, 2.0 mM MgSO4·7H2O, 0.050 mM EDTA-Fe, 9.0 μM MnCl2·4H2O, 0.80 μM ZnSO4·7H2O, 0.30 μM CuSO4·5H2O, 0.10 μM Na2MoO4·2H2O, and 46 μM H3BO3.油菜幼苗的培养在一个病了uminated chamber following the growth regimes: light intensity of 300–320 μmol m− 2 s− 1, temperature of 25 °C daytime/22 °C night, light period of 16 h photoperiod/ 8 h dark, and relative humidity of 70%.
For the nitrate (NO3−) depletion treatment, the 7-d-old uniformB. napusseedlings were hydroponically cultivated under high (6.0 mM) nitrate for 10 d, and then were grown under low (0.30 mM) nitrate for 3 d until sampling. For the ammonium (NH4+) toxicity treatment, the 7-d-old uniformB. napusseedlings after seed germination were hydroponically cultivated under high nitrate (6.0 mM) for 10 d, and then were grown under N-free condition for 3 d. Finally, the plants were grown under excess ammonium (9.0 Mm NH4+) for 6 h until sampling. For the inorganic phosphate (Pi) starvation treatment, the 7-d-old uniformB. napusseedlings after seed germination were first hydroponically grown under 250 μM phosphate (KH2PO4) for 10 d, and then were grown under 5 μM phosphate for 3 d until sampling. For the boron (B) deficiency treatment, the 7-d-old uniformB. napusseedlings after seed germination were first hydroponically grown under 10 μM H3BO3for 10 d, and then were transferred to 0.25 μM H3BO3for 3 d until sampling. For the cadmium (Cd) toxicity treatment, the 7-d-old uniformB. napusseedlings after seed germination were hydroponically cultivated in a Cd-free solution for 10 d, and then were transferred to 10 μM CdCl2for 12 h until sampling. For the salt stress treatment, the 7-d-old uniformB. napusseedlings after seed germination were hydroponically cultivated in a NaCl-free solution for 10 d, and then were transferred to 200 mM NaCl for 1 d until sampling. The shoots and roots were individually harvested and immediately stored at − 80 °C until RNA isolation. Each sample contained three independent biological replicates for the transcriptional analyses ofBnaAAPsunder diverse nutrient stresses.
Quantitative reverse-transcription PCR assays
The quantitative reverse-transcription polymerase chain reaction (qRT-PCR) assays were used to determine the relative expression ofBnaAAPs. After removing genomic DNA from the RNA samples with RNase-free DNase I, complementary DNA (cDNA) synthesis was performed using the PrimeScript™ RT reagent Kit with gDNA Eraser (Perfect Real Time) (TaKaRa, Shiga, Japan) with total RNA as the templates. We performed the quantitative analysis of relative gene expression by using the SYBR®Premix Ex Taq™ II (Tli RNaseH Plus) (TaKaRa, Shiga, Japan) kit in an Applied Biosystems StepOne™ Plus Real-time PCR System (Thermo Fisher Scientific, Waltham, MA, USA). The thermal recycle regimes were as follows: 95 °C for 3 min, followed by 40 cycles of 95 °C for 10 s, then 60 °C for 30 s [37]。We also conducted a melting curve analysis to ensure the primer specificity of target genes: 95 °C for 15 s, 60 °C for 1 min, and 60 °C–95 °C for 15 s (+ 0.3 °C per cycle). The public geneBnaEF1-α(forward: GCCTGGTATGGTTGTGACCT; reverse: GAAGTTAGCAGCACCCTTGG) [88] was used as internal references, and the gene expression abundances that were calculated with the slightly modified 2-ΔΔCTmethod [89], and the results were showed by heat maps. To ensure the result consistency, we also used a second reference geneBnaGDI1(forward: GAGTCCCTTGCTCGTTTCC; reverse: TGGCAGTCTCTCCCTCAGAT) [90] to confirm the gene expression consistency. The gene-specific primers for the qRT-PCR assays were listed in the additional file: Table S3.
Statistical analysis
Statistical analysis was performed using the Student’st-test, followed by the Tukey’s honestly significant difference (HSD) tests, with the Statistical Productions and Service Solutions (SPSS) 17.0 toolkit. Considering that the qRT-PCR data are normally distributed without log-transformation, we determined the significant difference (P < 0.05) in the expression of the target genes using the raw data.
Availability of data and materials
All the data and materials that are required to reproduce these findings can be shared by contacting the corresponding author, Dr. Ying-peng Hua (yingpenghua@zzu.edu.cn).
Abbreviations
- AA:
-
Amino acid
- AAP:
-
Amino acid permease
- AAT:
-
Amino acid transporter
- At:
-
Arabidopsis thaliana
- B:
-
Boron
- Bna:
-
Brasssica napus
- Bol:
-
Brassica oleracea
- Bra:
-
Brassica rapa
- BRAD:
-
BrassicaDatabase
- Cd:
-
Cadmium
- CNV:
-
Copy number variation
- CRE:
-
Cis-acting regulatory element
- DEGs:
-
Differentially expressed genes
- DGE:
-
Differential gene expression
- gDNA:
-
Genomic DNA
- N:
-
Nitrogen
- NCBI:
-
National Center for Biotechnology Information
- NH4+:
-
Ammonium
- NO3−:
-
Nitrate
- NUE:
-
Nitrogen use efficiency
- Pi:
-
Phosphate
- qRT-PCR:
-
Quantitative reverse-transcription polymerase chain reaction;
- TAIR:
-
The Arabidopsis Information Resource;
- TF:
-
Transcription factor
References
Zhang GB, Meng S, Gong JM. The expected and unexpected roles of nitrate transporters in plant abiotic stress resistance and their regulation. Int J Mol Sci. 2018;19:3535.
Bloom AJ. The increasing importance of distinguishing among plant nitrogen sources. Curr Opin Plant Biol. 2015;25:10–6.
Peeters KMU, Vanlaere AJ. Amino-acid metabolism associated with N-mobilization from the flag leaf of wheat (Triticum aestivumL.) during grain development. Plant Cell Environ. 1994;17:131–41.
Lu K, Wu B, Wang J, Zhu W, Nie H, Qian J, Huang W, Fang Z. Blocking amino acid transporter OsAAP3 improves grain yield by promoting outgrowth buds and increasing tiller number in rice. Plant Biotechnol J. 2018;16:1710–22.
Besnard J, Zhao C, Avice JC, Vitha S, Hyodo A, Pilot G, Okumoto S. Arabidopsis UMAMIT24 and 25 are amino acid exporters involved in seed loading. J Exp Bot. 2018;69:5221–32.
Garneau MG, Tan Q, Tegeder M. Function of pea amino acid permease AAP6 in nodule nitrogen metabolism and export, and plant nutrition. J Exp Bot. 2018;69:5205–19.
Martho KF, de Melo AT, Takahashi JP, Guerra JM, Santos DC, Purisco SU, Melhem MS, Fazioli RD, Phanord C, Sartorelli P, Vallim MA, Pascon RC. Amino acid permeases and virulence inCryptococcus neoformans.PLoS One. 2016;11:e0163919.
费舍尔WN、厕所弟弟,科赫W, Ludewig U, KJ粗野的人,Tegeder M, Rentsch D, Wright EM, Frommer WB. Low and high affinity amino acid H+-cotransporters for cellular import of neutral and charged amino acids. Plant J. 2002;29:717–31.
Tegeder M, Rentsch D. 2010. Uptake and partitioning of amino acids and peptides. Mol Plant. 2010;3:997–1011.
Tegeder M, Masclaux-Daubresse C. Source and sink mechanisms of nitrogen transport and use. New Phytol. 2018;217:35–53.
Okumoto S, Koch W, Tegeder M, Fischer WN, Biehl A, Leister D, Stierhof YD, Frommer WB. Root phloem-specific expression of the plasma membrane amino acid proton co-transporter AAP3. J Exp Bot. 2004;55:2155–68.
Tegeder M, Hammes UZ. The way out and in: phloem loading and unloading of amino acids. Curr Opin Plant Biol. 2018;43:16–21.
Karmann J,穆勒B,哈姆是乌斯。长和winding road: transport pathways for amino acids in Arabidopsis seeds. Plant Reprod. 2018;31:253–61.
Wang J, Wu BW, Lu K, Wei Q, Qian JJ, Chen YP, Fang ZM. The amino acid permease OsAAP5 regulates tiller number and grain yield in rice. Plant Physiol. 2019;180:1031–45.
Perchlik M, Tegeder M. Improving plant nitrogen use efficiency through alteration of amino acid transport processes. Plant Physiol. 2018;175:235–47.
Svennerstam H, Ganeteg U, Näsholm T. Root uptake of cationic amino acids by Arabidopsis depends on functional expression of amino acid permease. New Phytol. 2008;18:620–30.
Hirner B, Fischer WN, Rentsch D, Kwart M, Frommer WB. Developmental control of H+/amino acid permease gene expression during seed development ofArabidopsis.Plant J. 1998;14:535–44.
Sanders A, Collier R, Trethewy A, Gould G, Sieker R, Tegeder M. AAP1 regulates import of amino acids into developing Arabidopsis embryos. Plant J. 2009;59:540–52.
Schmidt R, Stransky H, Koch W. The amino acid permease AAP8 is important for early seed development inArabidopsis thaliana.Planta. 2007;226:805–13.
Birnbaum K, Shasha DE, Wang JY, Jung JW, Lambert GM, Galbraith DW, Benfey PN. A gene expression map of the Arabidopsis root. Science. 2003;302:1956–60.
Okumoto S, Schmidt R, Tegeder M, Fischer WN, Rentsch D, Frommer WB, Koch W. High affinity amino acid transporters specifically expressed in xylem parenchyma and developing seeds ofArabidopsis.J Biol Chem. 2002;277:45338–46.
Zhang L, Tan Q, Lee R, Trethewy A, Lee YH, Tegeder M. Altered xylem-phloem transfer of amino acids affects metabolism and leads to increased seed yield and oil content inArabidopsis.Plant Cell. 2010;22:3603–20.
Bayer PE, Hurgobin B, Golicz AA, et al. Assembly and comparison of two closely relatedBrassica napusgenomes. Plant Biotechnol J. 2017;15:1602–10.
Chalhoub B, Denoeud F, Liu SY, et al. Early allopolyploid evolution in the post-NeolithicBrassica napusoilseed genome. Science. 2014;345:950–3.
Sun F, Fan G, Hu Q, Zhou Y, et al. The high-quality genome ofBrassica napuscultivar ‘ZS11’ reveals the introgression history in semi-winter morphotype. Plant J. 2017;92:452–68.
Rathke GW, Christen O, Diepenbrock W. Effects of nitrogen source and rate on productivity and quality of winter oilseed rape (Brassica napusL.) grown in different crop rotations. Field Crops Res. 2005;94:103–s.
Clément G, Moison M, Soulay F, Reisdorf-Cren M, Masclaux-Daubresse C. Metabolomics of laminae and midvein during leaf senescence and source-sink metabolite management inBrassica napusL. leaves. J Exp Bot. 2017;69:891–903.
Avice JC, Etienne P. Leaf senescence and nitrogen remobilization efficiency in oilseed rape (Brassica napusL.). J Exp Bot. 2014;65:3813–24.
Girondé A, Etienne P, Trouverie J, et al. The contrasting N management of two oilseed rape genotypes reveals the mechanisms of proteolysis associated with leaf N remobilization and the respective contributions of leaves and stems to N storage and remobilization during seed filling. BMC Plant Biol. 2015;15:59.
Xu G, Guo C, Shan H, Kong H. Divergence of duplicate genes in exon-intron structure. Proc Natl Acad Sci U S A. 2012;109:1187–92.
Schmidt R, Acarkan A, Boivin K. Comparative structural genomics in the Brassicaceae family. Plant Physiol Bioch. 2001;39:253–62.
Schranz ME, Lysak MA, Mitchell-Olds T. The ABC's of comparative genomics in the Brassicaceae: building blocks of crucifer genomes. Trends Plant Sci. 2006;11:535–42.
Yang Y, Lai K, Tai P, Li W. Rates of nucleotide substitution in angiosperm mitochondrial DNA sequences and dates of divergence between Brassica and other angiosperm lineages. J Mol Evol. 1999;48:597–604.
Su YH, Frommer WB, Ludewig U. Molecular and functional characterization of a family of amino acid transporters from Arabidopsis. Plant Physiol. 2004;136:3104–13.
Guruprasad K, Reddy BV, Pandit MW. Correlation between stability of a protein and its dipeptide composition: a novel approach for predicting in vivo stability of a protein from its primary sequence. Protein Eng. 1990;4:155–61.
Wittkopp PJ, Kalay G.Cis-regulatory elements: molecular mechanisms and evolutionary processes underlying divergence. Nat Rev Genet. 2011;6:59–69.
Sheflin AM, Chiniquy D, Yuan C, Goren E, Kumar I, Braud M, Brutnell T, Eveland AL, Tringe S, Liu P, Kresovich S, Marsh EL, Schachtman DP, Prenni JE. Metabolomics of sorghum roots during nitrogen stress reveals compromised metabolic capacity for salicylic acid biosynthesis. Plant Direct. 2019;3:e00122.
Hu B, Jiang Z, Wang W, et al. Nitrate-NRT1.1B-SPX4 cascade integrates nitrogen and phosphorus signalling networks in plants. Nat Plants. 2019;5:637.
Loomis WD, Durst RW. 1992. Chemistry and biology of boron. BioFactors. 1992;3:229–39.
Hua Y, Zhou T, Ding G, Yang Q, Shi L, Xu F. Physiological, genomic and transcriptional diversity in responses to boron deficiency in rapeseed genotypes. J Exp Bot. 2016a;67:5769–84.
Hua Y, Zhang D, Zhou T, He M, Ding G, Shi L, Xu F. Transcriptomics-assisted quantitative trait locus fine mapping for the rapid identification of a nodulin 26-like intrinsic protein gene regulating boron efficiency in allotetraploid rapeseed. Plant Cell Environ. 2016b;39:1601–18.
Wang Z, Wang Z, Shi L, Wang L, Xu F. Proteomic alterations ofBrassica napusroot in response to boron deficiency. Plant Mol Biol. 2010;74:265–78.
Dong X, Liu G, Wu X, et al. Different metabolite profile and metabolic pathway with leaves and roots in response to boron deficiency at the initial stage of citrus rootstock growth. Plant Physiol Bioch. 2016;108:121–31.
Zhang H, Reynolds M. Cadmium exposure in living organisms: a short review. Sci Total Environ. 2019;678:761–7.
Zhang ZH, Zhou T, Tang TJ, Song HX, Guan CY, Huang JY, Hua YP. A multiomics approach reveals the pivotal role of subcellular reallocation in determining rapeseed resistance to cadmium toxicity. J Exp Bot. 2019;70:5437–55.
Chia MA, Lombardi AT, da Graça Gama Melão M, Parrish CC. Combined nitrogen limitation and cadmium stress stimulate total carbohydrates, lipids, protein and amino acid accumulation inChlorella vulgaris(Trebouxiophyceae). Aquat Toxicol. 2015;160:87–95.
Kumar M, Kumari P, Gupta V, Anisha PA, Reddy CRK, Jha B. Differential responses to cadmium induced oxidative stress in marine macroalgaUlva lactuca(Ulvales, Chlorophyta). Biometals. 2010;23:315–25.
Kovacik J, Klejdus B, Hedbavny J, Backor M. Effect of copper and salicyclic acid on phenolic metabolites and free amino acids inScenedesmus quadricauda(Chlorophyceae). Plant Sci. 2010;178:307–11.
Shokri-Gharelo R, Noparvar PM. Molecular response of canola to salt stress: insights on tolerance mechanisms. Peer J. 2018;6:e4822.
Xie Y, Sun X, Feng Q, Luo H, Wassie M, Amee M, Amombo E, Chen L. Comparative physiological and metabolomic analyses reveal mechanisms ofAspergillus aculeatus-mediated abiotic stress tolerance in tall fescue. Plant Physiol Biochem. 2019;142:342–50.
Wang T, Chen Y, Zhang M, Chen J, Liu J, Han H, Hua X. Arabidopsis AMINO ACID PERMEASE1 contributes to salt stress-induced proline uptake from exogenous sources. Front Plant Sci. 2017;8:2182.
华YP,Zhou T, Song HX, Guan CY, Zhang ZH. Integrated genomic and transcriptomic insights into the two-component high-affinity nitrate transporters in allotetraploid rapeseed. Plant Soil. 2018;427:245–68.
Ohno s基因重复和版本的唯一性tebrate genomes circa 1970-1999. Semin Cell Dev Biol. 1999;10:517–22.
Parkin IA, Gulden SM, Sharpe AG, Lukens L, Trick M, Osborn TC, Lydiate DJ. Segmental structure of theBrassica napusgenome based on comparative analysis withArabidopsis thaliana.Genetics. 2005;171:765–81.
Verbruggen N, Hermans C. Proline accumulation in plants: a review. Amino Acids. 2008;35:752–9.
Wan Y, King R, Mitchell RAC, Hassani-Pak K, Hawkesford MJ. Spatiotemporal expression patterns of wheat amino acid transporters reveal their putative roles in nitrogen transport and responses to abiotic stress. Sci Rep. 2017;7:5461.
Evans JR, Clarke VC. The nitrogen cost of photosynthesis. J Exp Bot. 2019;70:7–15.
Liu W, Sun Q, Wang K, Du Q, Li WX. Nitrogen Limitation Adaptation (NLA) is involved in source-to-sink remobilization of nitrate by mediating the degradation of NRT1.7 inArabidopsis.New Phytol. 2017;214:734–44.
Tilsner J, Kassner N, Struck C, Lohaus G. Amino acid contents and transport in oilseed rape (Brassica napusL.) under different nitrogen conditions. Planta. 2005;221:328–38.
Song J, Jiang L, Jameson PE. Expression patterns ofBrassica napusgenes implicate IPT, CKX, sucrose transporter, cell wall invertase, and amino acid permease gene family members in leaf, flower, silique, and seed development. J Exp Bot. 2015;66:5067–82.
Liu Y, von Wirén N. Ammonium as a signal for physiological and morphological responses in plants. J Exp Bot. 2017;68:2581–92.
Vega-Mas I, Cukier C, Coleto I, González-Murua C, Limami AM, González-Moro MB, Marino D. Isotopic labelling reveals the efficient adaptation of wheat root TCA cycle flux modes to match carbon demand under ammonium nutrition. Sci Rep. 2019;9:8925.
Koch W, Kwart M, Laubner M, Heineke D, Stransky H, Frommer WB, Tegeder M. Reduced amino acid content in transgenic potato tubers due to antisense inhibition of the leaf H+/amino acid symporter StAAP1. Plant J. 2003;33:211–20.
Zhang L, Garneau MG, Majumdar R, Grant J, Tegeder M. Improvement of pea biomass and seed productivity by simultaneous increase of phloem and embryo loading with amino acids. Plant J. 2015;81:134–46.
Rong-Mullins X, Ravishankar A, McNeal KA, Lonergan ZR, Biega AC, Creamer JP, Gallagher JEG. Genetic variation in Dip5, an amino acid permease, and Pdr5, a multiple drug transporter, regulates glyphosate resistance inS. cerevisiae.PLoS One. 2017;12:e0187522.
Wang X, Wu J, Liang J, Cheng F, Wang X. Brassica database (BRAD) version 2.0: integrating and mining Brassicaceae species genomic resources. Database. 2015;2015:1–8.
Yu J, Zhao M, Wang X, Tong C, Huang S, Tehrim S, Liu Y, Hua W, Liu S. Bolbase: a comprehensive genomics database forBrassica oleracea.BMC Genomics. 2013;14:664.
Goodstein DM, Shu S, Howson R, Neupane R, Hayes RD, Fazo J, Mitros T, Dirks W, Hellsten U, Putnam N. Phytozome: a comparative platform for green plant genomics. Nucleic Acids Res. 2012;40:D1178–86.
Ostergaard L, King GJ. Standardized gene nomenclature for theBrassicagenus. Plant Methods. 2008;4:10.
Li S, Chen L, Zhang L, Li X, Liu Y, Wu Z, Dong F, Wan L, Liu K, Hong D, Yang G.BnaC9.SMG7bfunctions as a positive regulator of the number of seeds per silique inBrassica napusby regulating the formation of functional female gametophytes. Plant Physiol. 2015;169:2744–60.
Li H, Li J, Song J, Zhao B, Guo C, Wang B, Zhang Q, Wang J, King GJ, Liu K. An auxin signaling geneBnaA3.IAA7contributes to improved plant architecture and yield heterosis in rapeseed. New Phytol. 2019;222:837–51.
Larkin MA, Blackshields G, Brown NP, Chenna R, McGettigan PA, McWilliam H, Valentin F, Wallace IM, Wilm A, Lopez R, Thompson JD, Gibson TJ, Higgins DG. Clustal W and Clustal X version 2.0. Bioinformatics. 2007;23:2947–8.
Tamura K, Stecher G, Peterson D, Filipski A, Kumar S. MEGA6: molecular evolutionary genetics analysis version 6.0. Mol Biol Evol. 2013;30:2725–9.
Saitou N, Nei M. The neighbor-joining method: a new method for reconstructing phylogenetic trees. Mol Biol Evol. 1987;4:406–25.
Sievers F, Wilm A, Dineen DG, et al. Fast, scalable generation of high-quality protein multiple sequence alignments using Clustal omega. Mol Syst Biol. 2011;7:539.
Wang DP, Zhang YB, Zhang Z, Zhu J, Yu J. KaKs_Calculator 2.0: a toolkit incorporating gamma-series methods and sliding window strategies. Genomics Proteomics Bioinformatics. 2010;8:77–80.
Yang Z, Nielsen R. Estimating synonymous and nonsynonymous substitution rates under realistic evolutionary models. Mol Biol Evol. 2000;17:32–43.
Blanc G, Wolfe KH. Widespread paleopolyploidy in model plant species inferred from age distributions of duplicate genes. Plant Cell. 2004;16:1667–78.
Gasteiger E, Hoogland C, Gattiker A, Duvaud S, Wilkins MR, Appel RD, Bairoch A. Protein identification and analysis tools on the ExPASy server. In: Walker JM, editor. The Proteomics Protocols Handbook, Humana Press; 2005. p. 571–607.
Hamburger D, Horton P, Park KJ, Obayashi T, Fujita N, Harada H. Adams-Collier C J (2007) WoLF PSORT: protein localization predictor. Nucleic Acids Res. 2007;35:W585–7.
Petersen TN, Brunak S, von Heijne G, Nielsen H. SignalP 4.0: discriminating signal peptides from transmembrane regions. Nat Methods. 2011;8:785–6.
Harrison RG, Bagajewicz MJ. Predicting the solubility of recombinant proteins inEscherichia coli.Methods Mol Biol. 2015;1258:403–8.
Szklarczyk D, Gable AL, Lyon D, Junge A, Wyder S, Huerta-Cepas J, Simonovic M, Doncheva NT, Morris JH, Bork P, Jensen LJ, von Mering C. STRING v11: protein-protein association networks with increased coverage, supporting functional discovery in genome-wide experimental datasets. Nucleic Acids Res. 2019;47:D607–13.
Bailey TL, Boden M, Buske FA, Frith M, Grant CE, Clementi L, Ren J, Li WW, Noble WS. MEME SUITE: tools for motif discovery and searching. Nucleic Acids Res. 2009;37:W202–8.
Crooks GE, Hon G, Chandonia JM, Brenner SE. WebLogo: A sequence logo generator. Genome Res. 2004;14:1188–90.
Higo K, Ugawa Y, Iwamoto M, Korenaga T. Plantcis-acting regulatory DNA elements (PLACE) database: 1999. Nucleic Acids Res. 1999;27:297–300.
Winter D, Vinegar B, Nahal H, Ammar R, Wilson GV. Provart NJ. PLoS One. 2007;2:e718.
Maillard AP, Etienne S, Diquélou J, Trouverie V, Billard V, Yvin JC, Ourry A. Nutrient deficiencies inBrassica napusmodify the ionomic composition of plant tissues: a focus on cross-talk between molybdenum and other nutrients. J Exp Bot. 2016;67:5631–41.
Livak KJ, Schmittgen TD. Analysis of relative gene expression data using real-time quantitative PCR and the 2-ΔΔCTmethod. Methods. 2001;25:402–8.
Yang HL, Liu J, Huang SM, Guo TT, Deng LB, et al. Selection and evaluation of novel reference genes for quantitative reverse transcription PCR (qRT-PCR) based on genome and transcriptome data inBrassica napusL. Gene. 2014;538:113–22.
Acknowledgements
Not applicable.
Funding
This study was financially supported by the National Natural Science Foundation of China (Grant NO. 31801923). The funder was not involved in the experimental design of the study, data collection, analysis and interpretation, and in writing the manuscript.
Author information
Affiliations
Contributions
HYP, ZT and HJY was involved in data interpretation. CJQ, LY, WWM, and TC cultivated the rapeseed plants, and made the experiments. HJY and HYP designed the study, and ZT and YCP wrote the manuscript. All the authors read and approved the final version of the manuscript.
Corresponding author
Ethics declarations
Ethics approval and consent to participate
In this study, all the seeds of rapeseed plants were obtained from our research group led by Prof. Jin-yong Huang (jinyhuang@zzu.edu.cn, Zhengzhou University, Zhengzhou, 45000, Henan Province, China).
Consent for publication
Not applicable.
Competing interests
The authors declare that they have no competing interests.
Additional information
Publisher’s Note
施普林格自然仍中性再保险gard to jurisdictional claims in published maps and institutional affiliations.
Supplementary information
Additional file 1: Table S1.
Molecular characterization of the amino acid permease (AAP) proteins inBrassica napus.Table S2.Differential expression of eachamino acid permease(AAP) gene under diverse nutrient stresses.Table S3.Raw expression data for theamino acid permease (AAP)family genes under diverse nutrient stresses.Figure S1.Rooted phylogeny analysis of theAAPgenes in allotetraploid rapeseed.Figure S2.Trans-membrane characterization of the amino acid permease (AAP) proteins inArabidopsis thaliana.The TMHMM (http://www.cbs.dtu.dk/services/TMHMM/) tool was used to predict the transmembrane topology of the AtAAP proteins.Figure S3.Characterization of signal peptides of the amino acid permease (AAP) proteins inArabidopsis thaliana.The SignalP (http://www.cbs.dtu.dk/services/SignalP/) 4.0 server was used to predict the presence and location of signal peptide cleavage sites in the amino acid sequences of the AtAAP proteins.Figure S4.Tissue-specific expression patterns of theamino acid permease(AAP) genes inArabidopsis thaliana.(A-H) Relative expression abundances ofAtAAP1(A),AtAAP2(B),AtAAP3(C),AtAAP4(D),AtAAP5(E),AtAAP6(F),AtAAP7(G) andAtAAP8(H) in various tissues. The red and yellow color indicates relative high and low expression levels ofAtAAPs.
Rights and permissions
Open Access本文是在Creative Commons许可Attribution 4.0 International License, which permits use, sharing, adaptation, distribution and reproduction in any medium or format, as long as you give appropriate credit to the original author(s) and the source, provide a link to the Creative Commons licence, and indicate if changes were made. The images or other third party material in this article are included in the article's Creative Commons licence, unless indicated otherwise in a credit line to the material. If material is not included in the article's Creative Commons licence and your intended use is not permitted by statutory regulation or exceeds the permitted use, you will need to obtain permission directly from the copyright holder. To view a copy of this licence, visithttp://creativecommons.org/licenses/by/4.0/.The Creative Commons Public Domain Dedication waiver (http://creativecommons.org/publicdomain/zero/1.0/) applies to the data made available in this article, unless otherwise stated in a credit line to the data.
关于这篇文章
Cite this article
Zhou, T., Yue, Cp., Huang, Jy.et al.Genome-wide identification of theamino acid permeasegenes and molecular characterization of their transcriptional responses to various nutrient stresses in allotetraploid rapeseed.BMC Plant Biol20,151 (2020). https://doi.org/10.1186/s12870-020-02367-7
Received:
Accepted:
Published:
DOI:https://doi.org/10.1186/s12870-020-02367-7
Keywords
- Allotetraploid
- Amino acid permease
- Brassica napus
- Genome-wide identification
- Nutrient stresses

