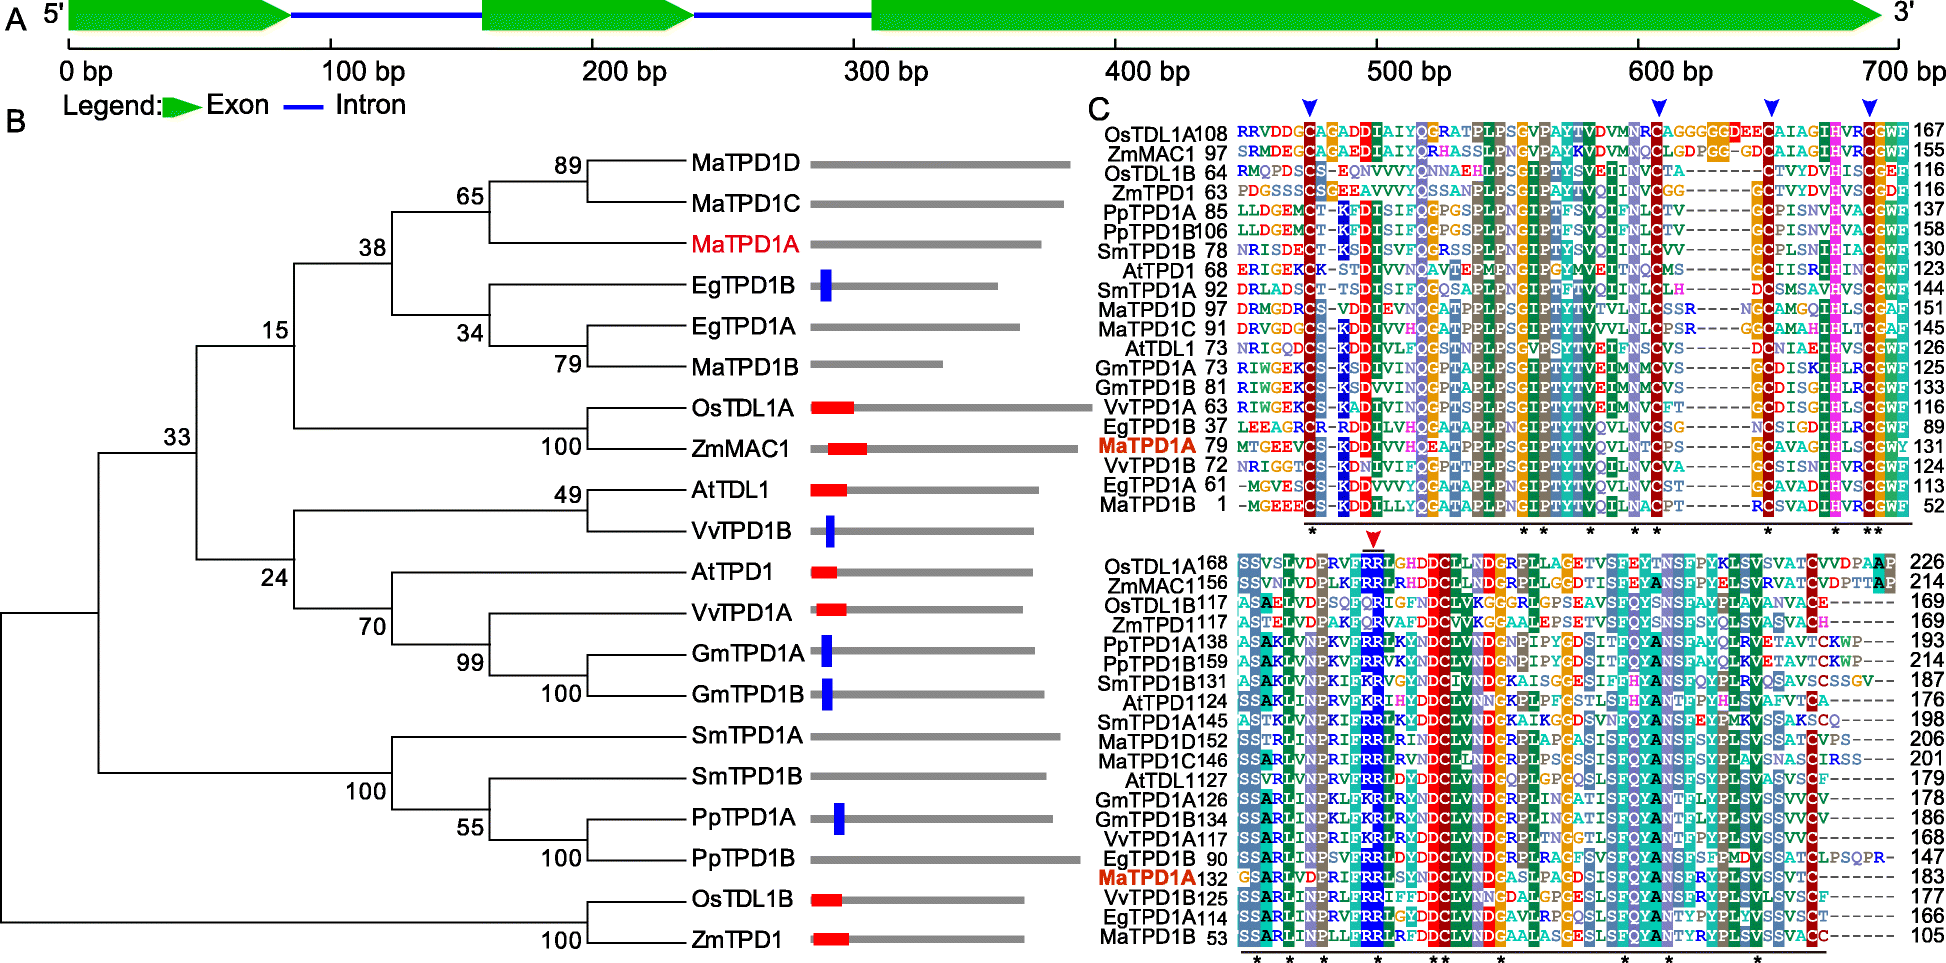
Fig. 1

Sequence analysis of banana TPD1 homologs.aSchematic representation of the sequence organization ofMaTPD1A.bPhylogenetic analysis of TPD1 and the related homologs. The amino acid sequences were aligned using Clustal Omega, and the tree was drawn with the neighbor-joining method using MEGA software 5.0 (http://megasoftware.net/). The architecture of each gene was obtained from SMART using the architecture analysis function. The red frame indicates a signal peptide; the blue frame indicates a transmembrane domain. EgTPD1A, PpTPD1B, SmTPD1A, SmTPD1B, MaTPD1A, MaTPD1C, and MaTPD1D had no matches in the SMART database. Detailed sequence information is as follows: AtTPD1 (AAR25553.1); AtTDL1 (ABF59206.1); EgTPD1A (XP_010936413.1); EgTPD1B (XP_019703285.1); GmTPD1A (XP_006581852.1); GmTPD1B (XP_014630314.1); OsTDL1A (BAG98429.1); OsTDL1B (BAH00567.1); PpTPD1A (XP_024360232.1); PpTPD1B (XP_024403645.1); SmTPD1A (XP_002981330.2); SmTPD1B (XP_002966893.2); VvTPD1A (XP_002280540.1); VvTPD1B (XP_010646260.1); ZmMAC1 (AEN03028.1); ZmTPD1 (ACG48634.1); MaTPD1A (Ma00_p03730.1); MaTPD1B (Ma08_p27040.1); MaTPD1C (Ma06_p07710.1); and MaTPD1D (Ma09_p01210.1).cCLUSTAL Omega alignment of TPD1 from various organisms showing the highly conserved region. At,Arabidopsis thaliana; Eg,Elaeis guineensis; Gm,Glycine max; Os, Oryza sativaJaponica Group; Pp,Physcomitrella patens; Sm, Selaginella moellendorffii; Vv,Vitis vinifera; Zm,Zea mays; Ma,Musa acuminata. The underlined region was the conserved C-terminal domain of TPD1 and its homologs; Blue arrow indicates the conserved cysteine residues that are essential for the normal function of AtTPD1; Red arrow representates the dibasic cleavage site of AtTPD1. Star indicates amino acids that are identical in all sequences
