Fig. 7

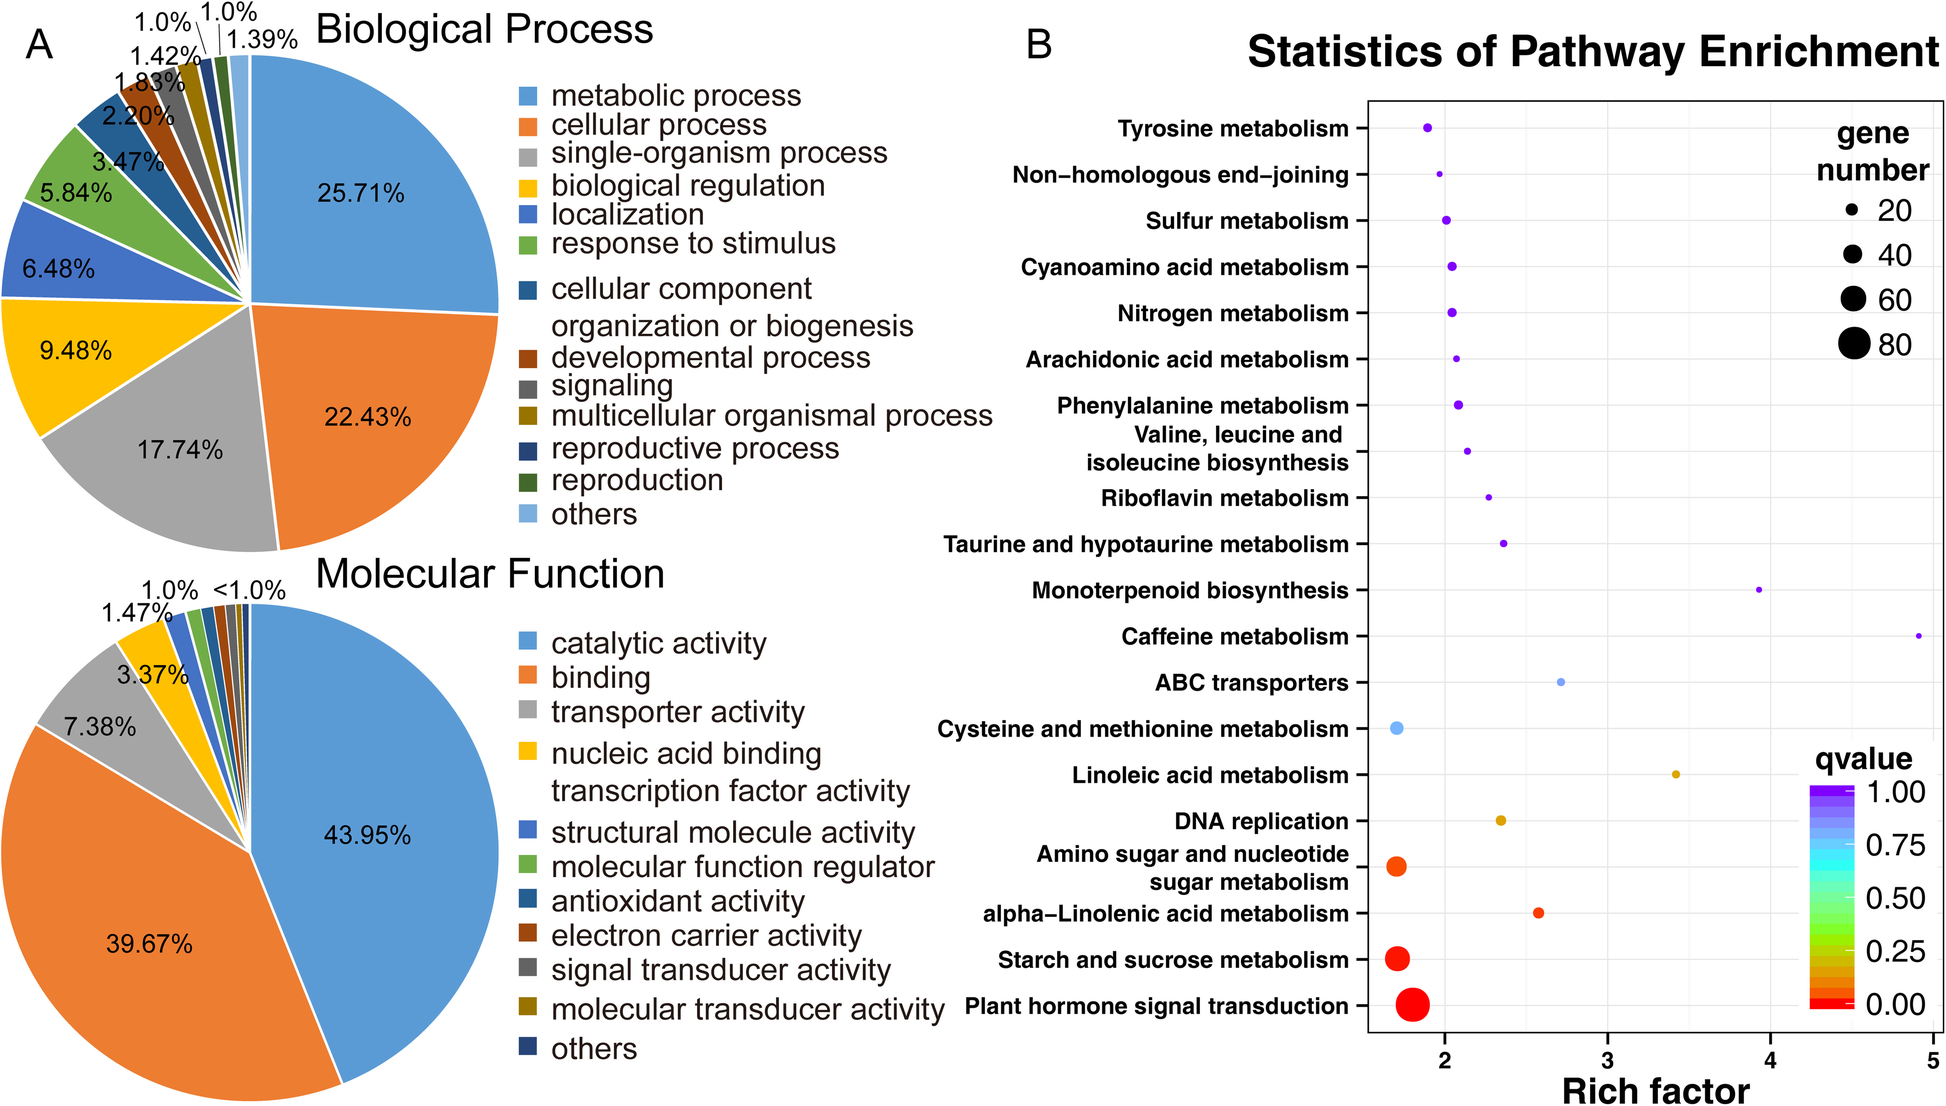
Functional categories and enriched pathways of the genes affected by MaTPD1A Overexpression.aThe genes that differentially expressed in the MaTPD1A-OE plant were classified into several biological processes categories and molecular functional categories base on the Gene Ontology Consortium database and enrichment pathways;bRepresentation of the 20 most-enriched KEGG pathways. The significance of the enrichment factor is indicated with the coloring of the q-values. The target genes of enriched pathways are shown using a circle, and the gene number is proportional to the size of the circle. The Y-axis and the X-axis represent the name of the enrichment pathway and the enrichment factor, respectively
