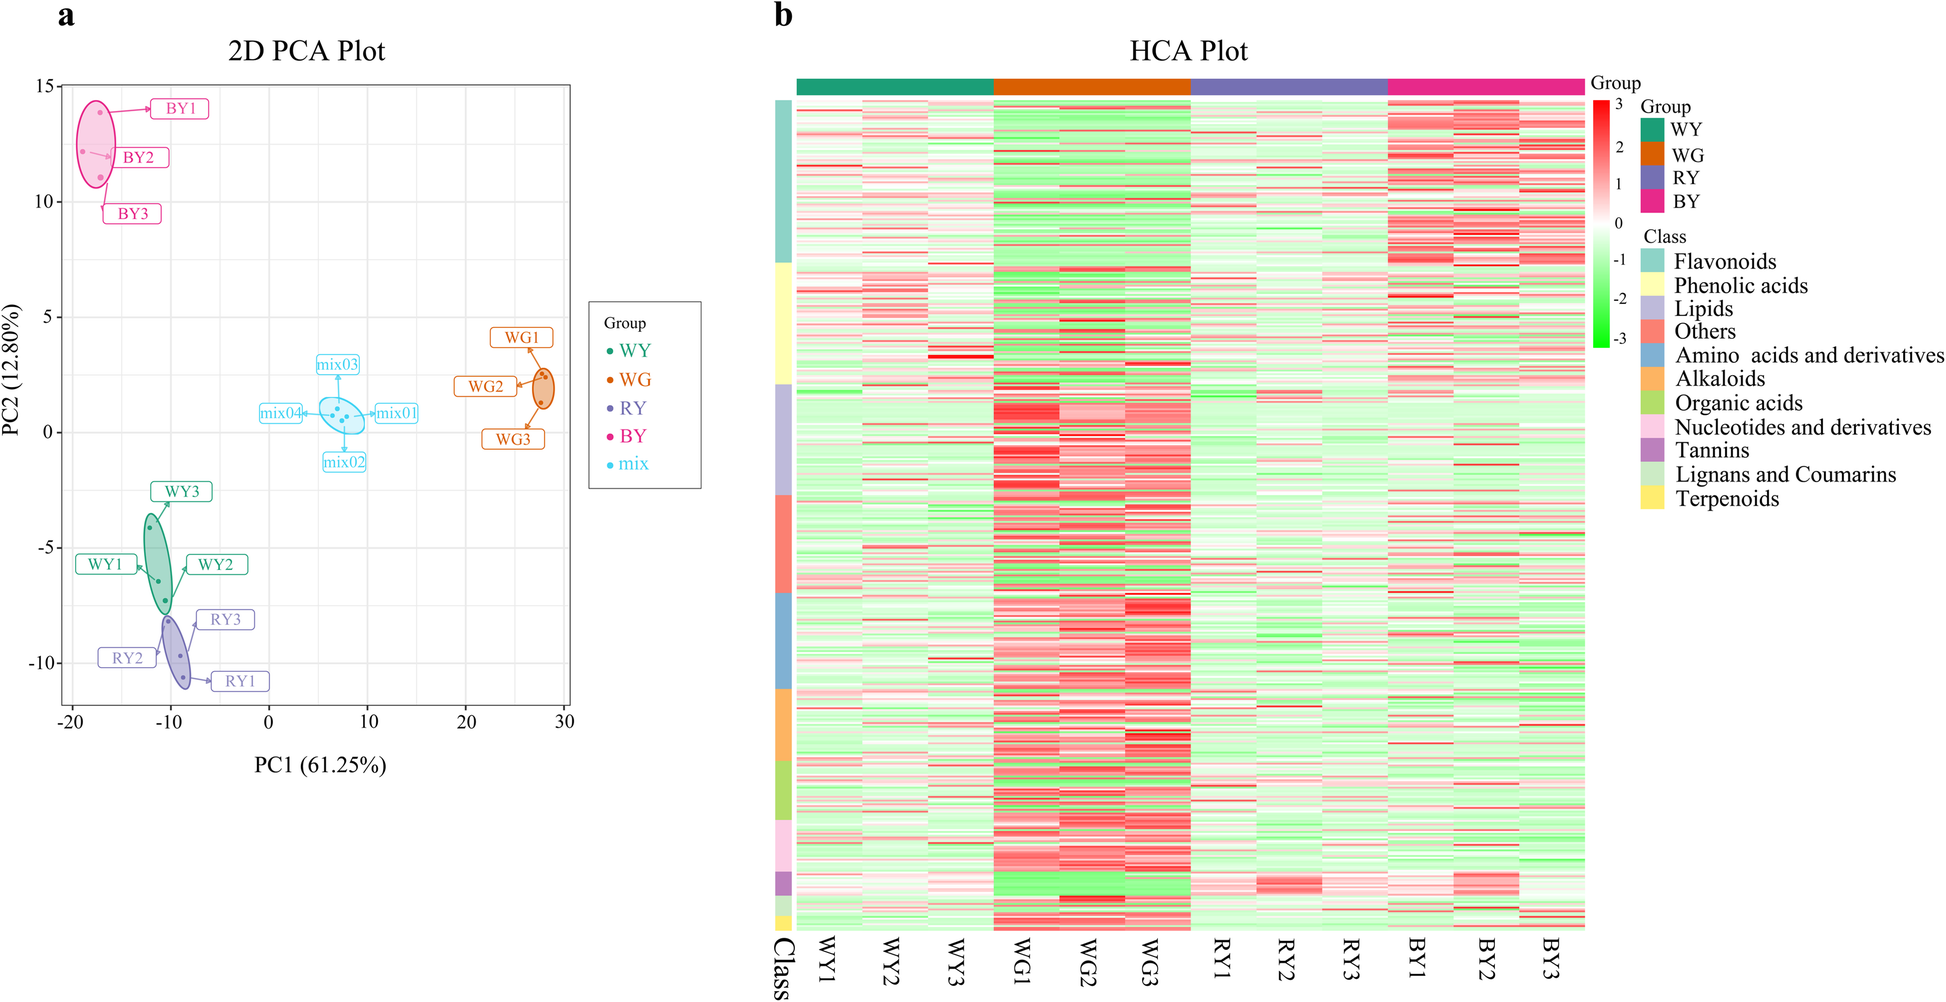
Fig. 2

Results of PCA and HCA analyses of 12 samples fromS. glabra.aIn PCA plot, PC1 (61.25% variance) and PC2 (12.8% variance) were used to generate the scores plot. Samples of WY, RY, BY, WG, and mix are marked in green, purple, pink, brown, and blue, respectively. The mix sample is a quality-control sample that was made of an equal mixture of all samples.bIn HCA plot, all the identified metabolites were divided into 11 classes, and each coloured rectangle represented the specific compound content. WY: Leaf tissue under white LED light; WG: Root tissue under white LED light; BY: Leaf tissue under blue LED light; RY: Leaf tissue under red LED light
