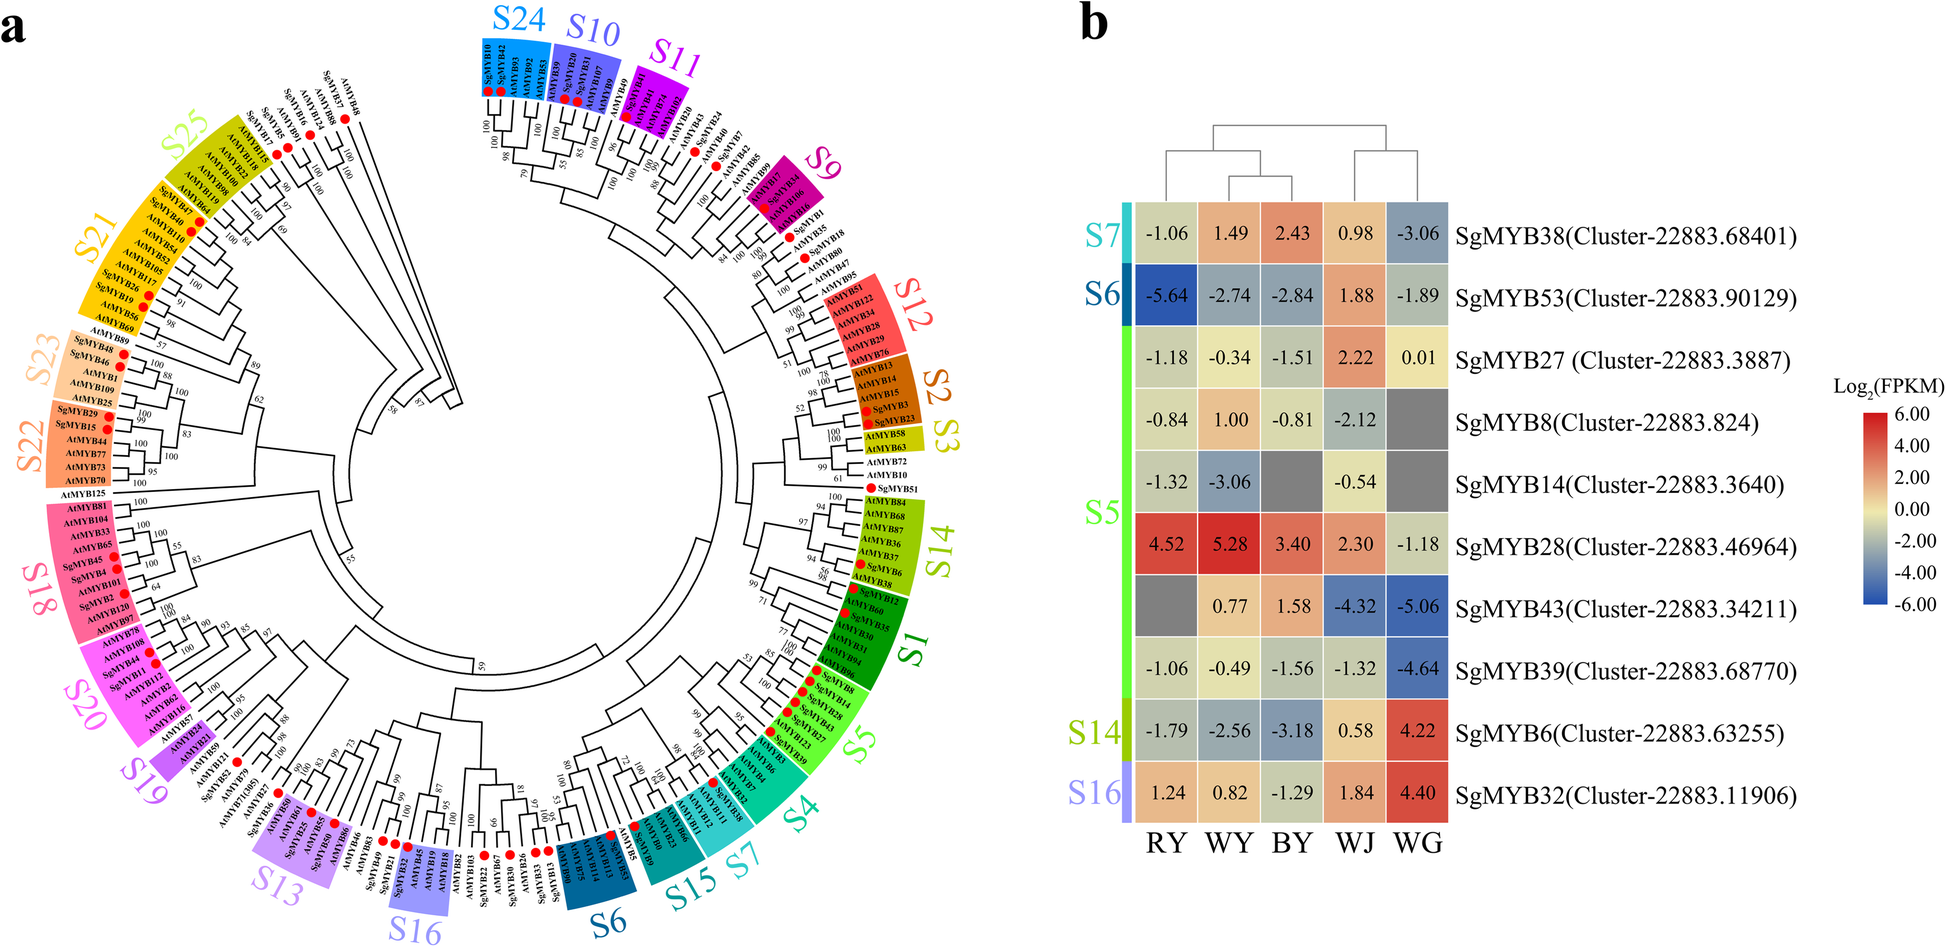
Fig. 6

Phylogenetic tree and heat map diagram with R2R3-MYB proteins. Bootstrap values are displayed as percentages (1000 replicates) when > 50%;aThe subgroups (S1-S25) of R2R3-MYB proteins inArabidopsishighlighted with different colors were designated as previously reported [31,35], and 53 genes encoding R2R3-MYB proteins ofS. glabrawere numbered randomly from 1 to 53. All the labeled R2R3-MYB amino acid sequences are given in Additional file14: Table S7;bAll the selectedR2R3-MYBgenes are listed on the vertical line. The scale represents the logarithms of the FPKM values of these genes. The grey squares without values mean that the FPKM values are zero
