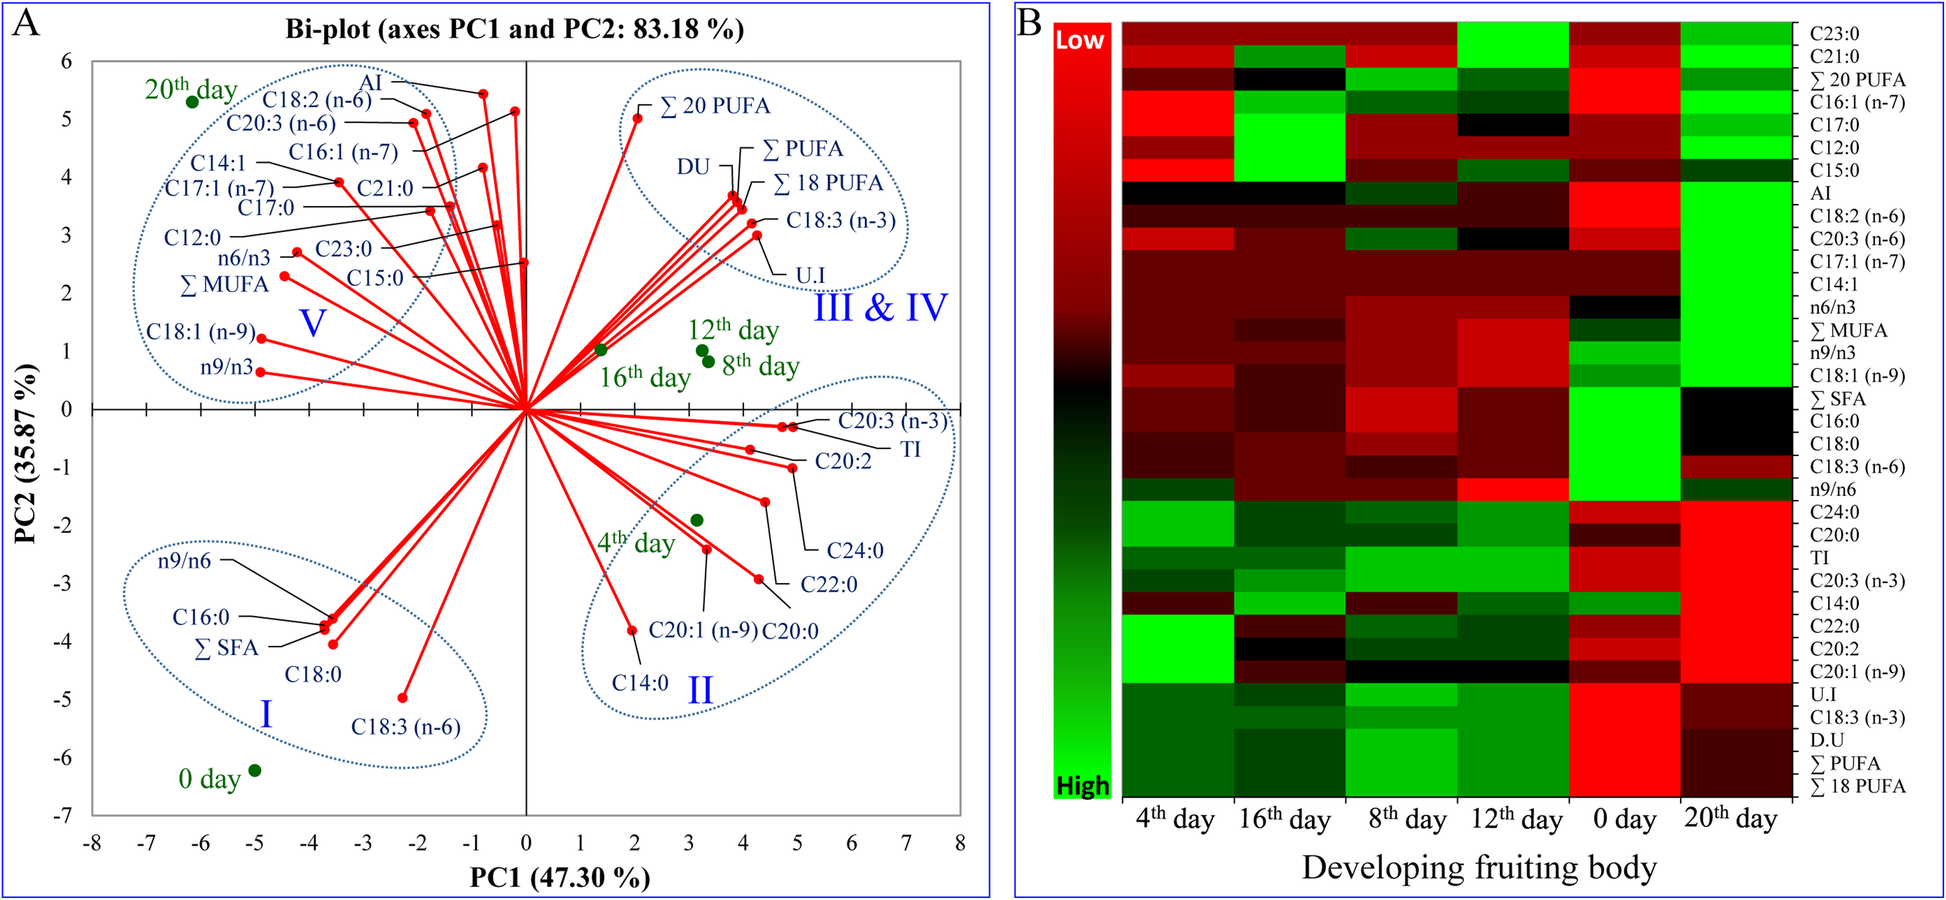
Fig. 3

Principal component analysis (PCA) and heat map of total lipids and fatty acids of developing fruit of psyllium.aBi-plot obtained from PCA of data matrix according to Table1with first two principal components.bHeat map of the differentially synthesised total lipids and fatty acids. All experiments were carried out three times, each with three biological replicate sets and each set contained three replicates. The colors (green to red via black) of the tiles in the heat map represent the values varying from high to low
