Fig. 3
From:Characterization of theGh4CLgene family reveals a role ofGh4CL7in drought tolerance

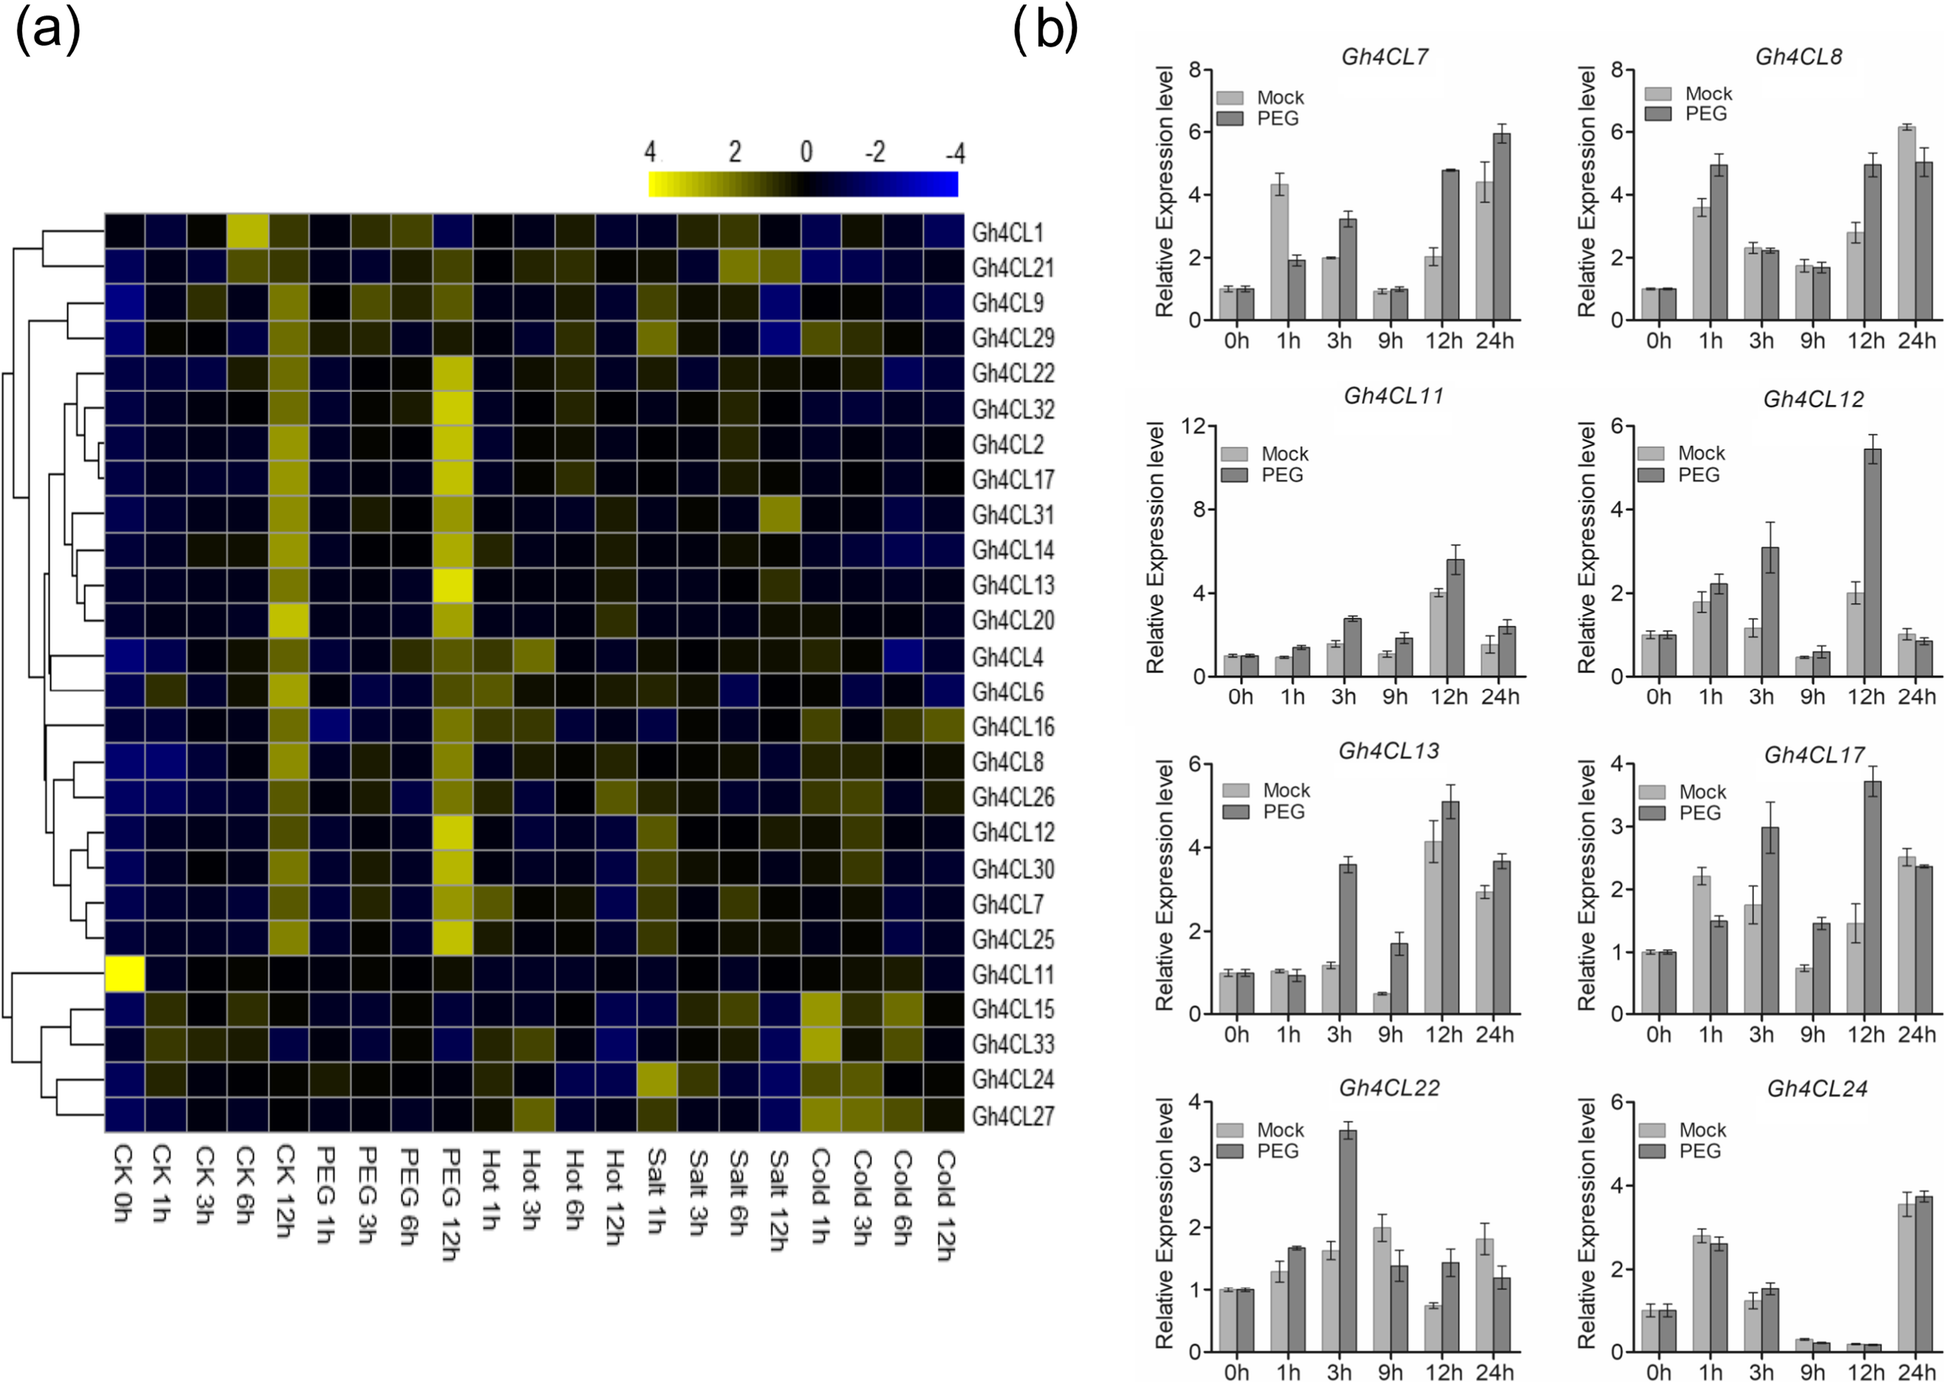
Expression profile of theGh4CLgenes in response to different abiotic stresses.aHeatmap showing the relative expression levels of eachGh4CLgene in each treatment showing at the bottom of the image.bThe relative expression level of the selectedGh4CLgenes under 20% PEG stress based on qRT-PCR. TheGhUBQ7gene was used as internal control. Error bars represents the standard deviation calculated from three biological replicates
