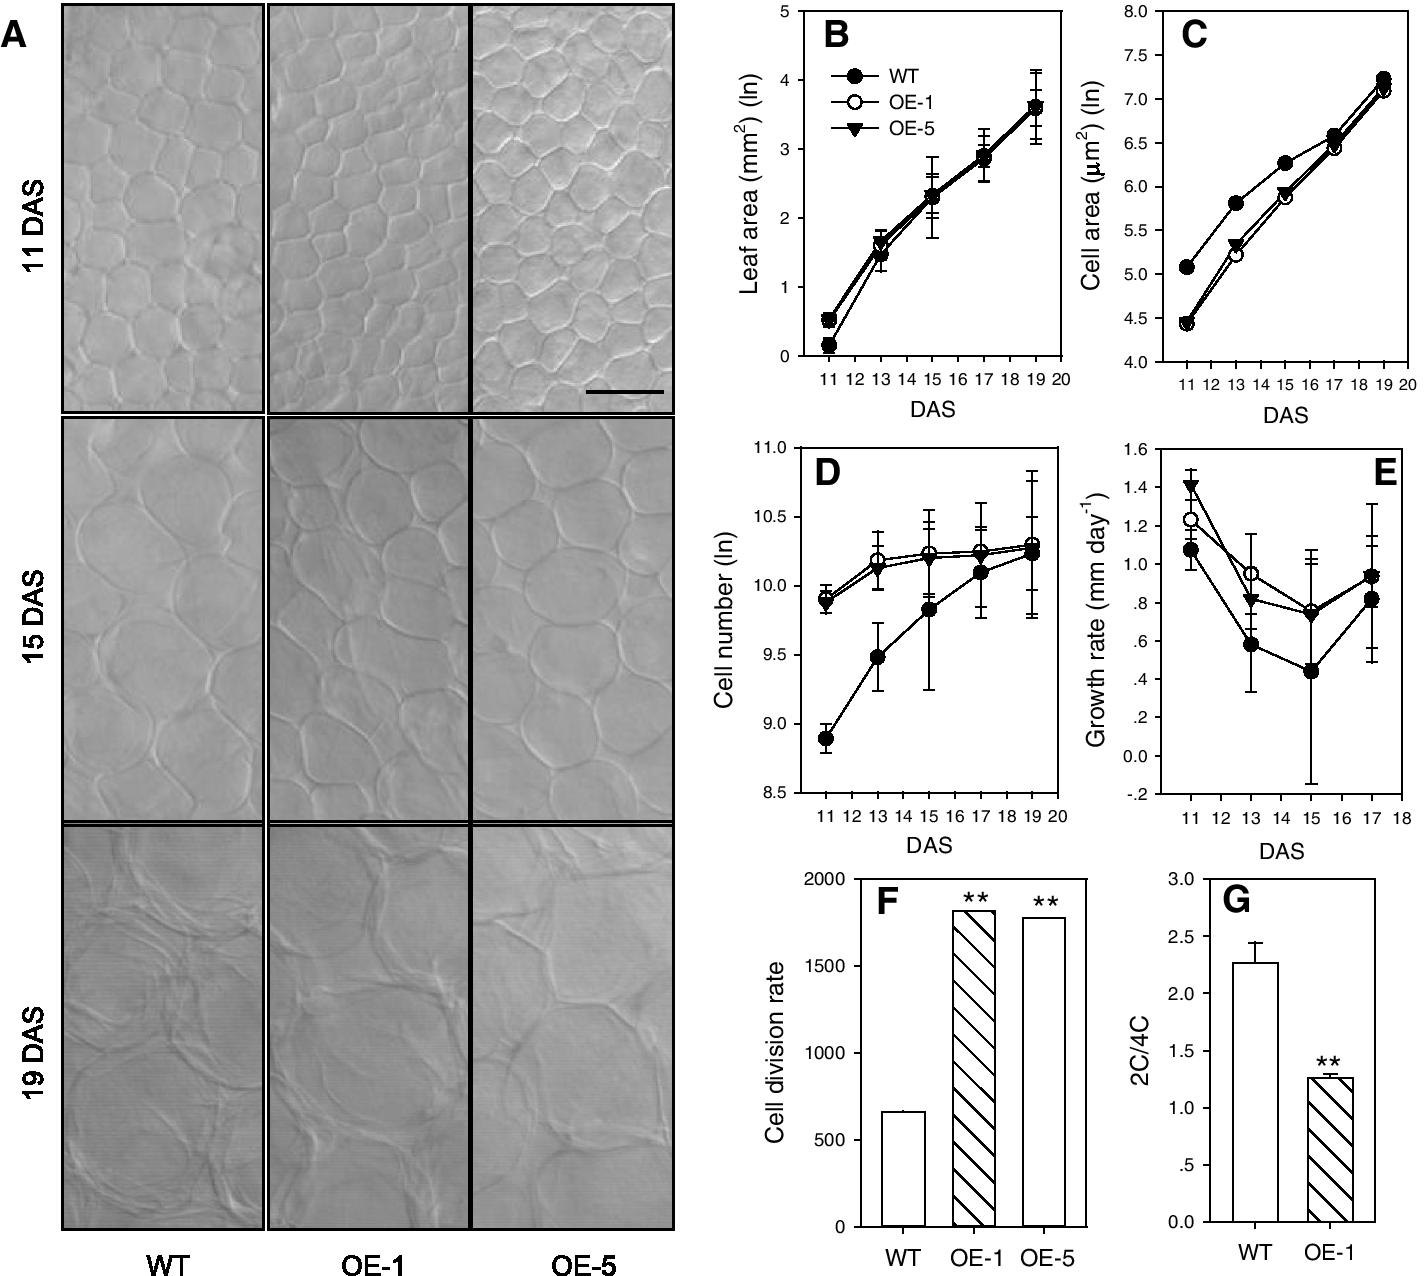
Fig. 4
From:Poplar aquaporinPIP1;1promotesArabidopsisgrowth and development

Characterization of the 3rdleaf in WT and twoPtoPIP1;1OEArabidopsislines (OE-1 and OE-5).aPalisade cells of the 3rdleaf from WT andPtoPIP1;1OE at 11, 15, and 19 days after stratification (DAS). Bar = 20 µm.bLeaf area, Means ± standard errors (n = 6 ~ 8) are shown.cPalisade cell area. The cell area was measured using 40 to 60 leaf cells from photographs of 6 to 8 leaves.dThe calculated cell number of the 3rdleaf from WT and twoPtoPIP1;1OE lines. Means ± standard errors (n = 6 ~ 8) are shown.eThe relative cell growth rate was calculated based on the data from A. The relative cell growth rate is expressed as the increase in cell area (µm2) relative to the previous cell area per unit of time (day).fThe average cell division rate was calculated based on the data from A. The average cell division rate of 11-DAS seedlings is expressed as the average cell number per unit of time.gThe ratio of 2C/4C cells from the 3rdleaf of WT andPtoPIP1;1OE lines at 11 DAS by flow cytometric analysis of their nuclear DNA content. Data for the ratio of 2C/4C represent the mean of six biological replicates with multiple leaves pooled in each replicate. Data were analyzed statistically using Student’st-test. **P < 0.01
