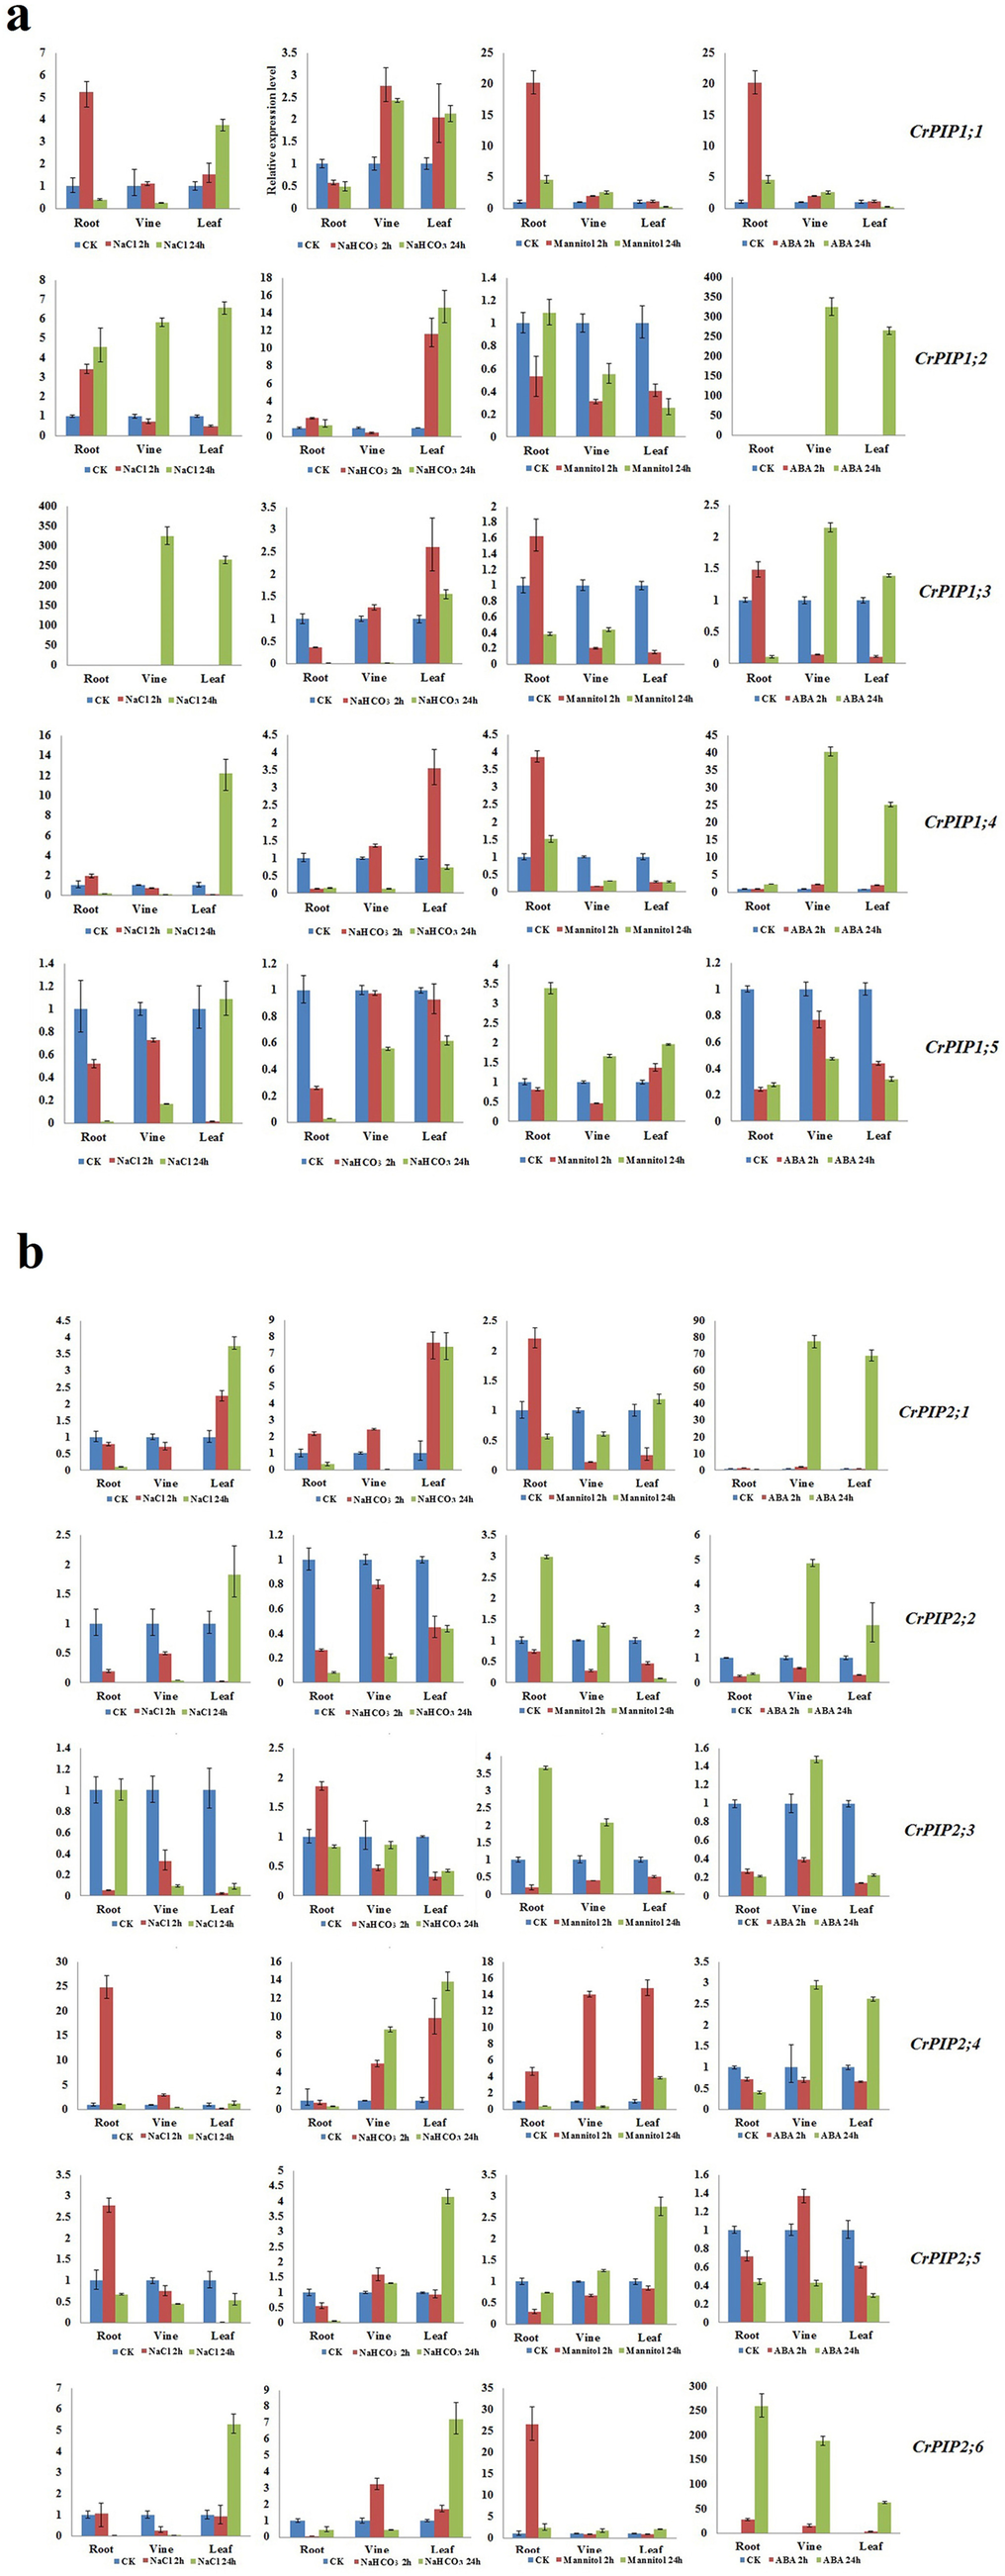
Fig. 6

Quantitative RT-PCR detection of the expression levels of the 11CrPIPs responding to different stresses (600 mM NaCl, 150 mM NaHCO3, 300 mM mannitol, and 100 mM ABA) inC. roseaseedling plants.a5CrPIP1s.b6CrPIP2s. Relative expression values were calculated using the 2 − ΔCt method with housekeeping geneCrEF-αas reference gene. Bars show mean values ± SD ofn = 3–4 technical replicates
