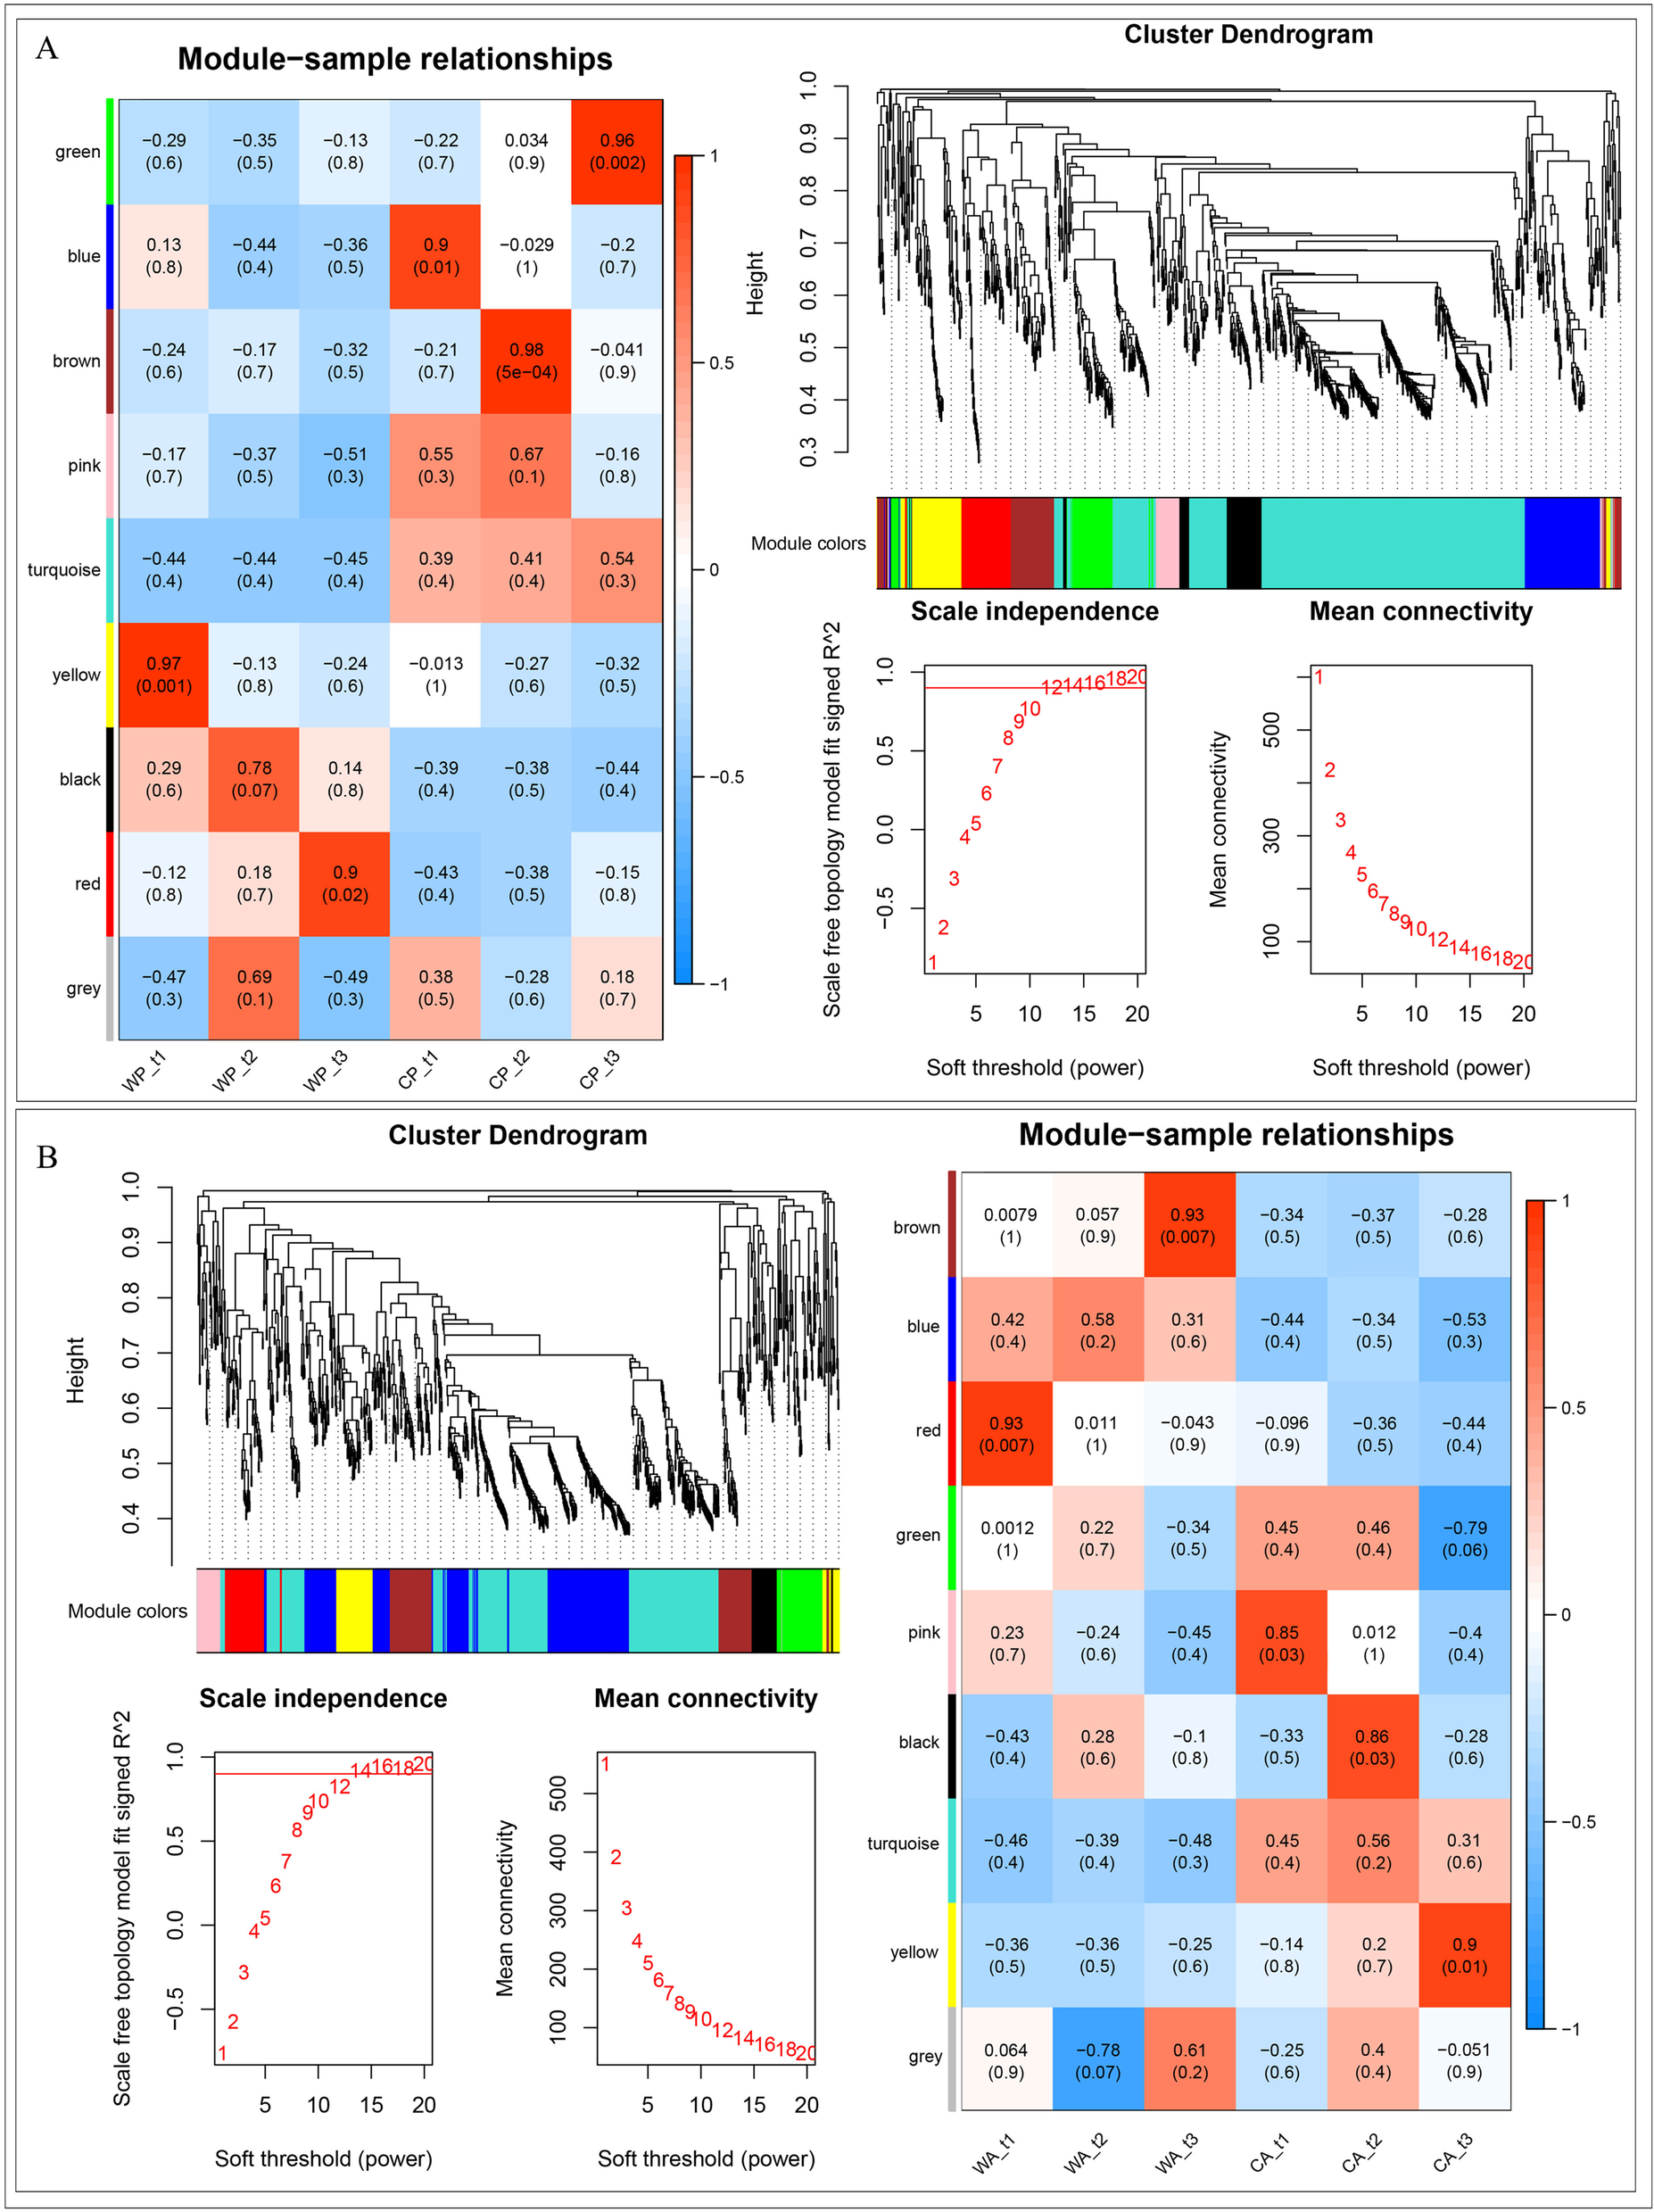
Fig. 7

Co-expression module of 1068 and 969 co-differential expression genes at three stages of pear (A) and apple (B) respectively. Screening of soft-threshold power as 14 atR2 = 0.8(red line), which divided genes into 9 color modules. Correlation between each module and six samples showed with the correlation coefficient andPvalue, red indicates positive correlation and blue means negative correlation
