Fig. 3

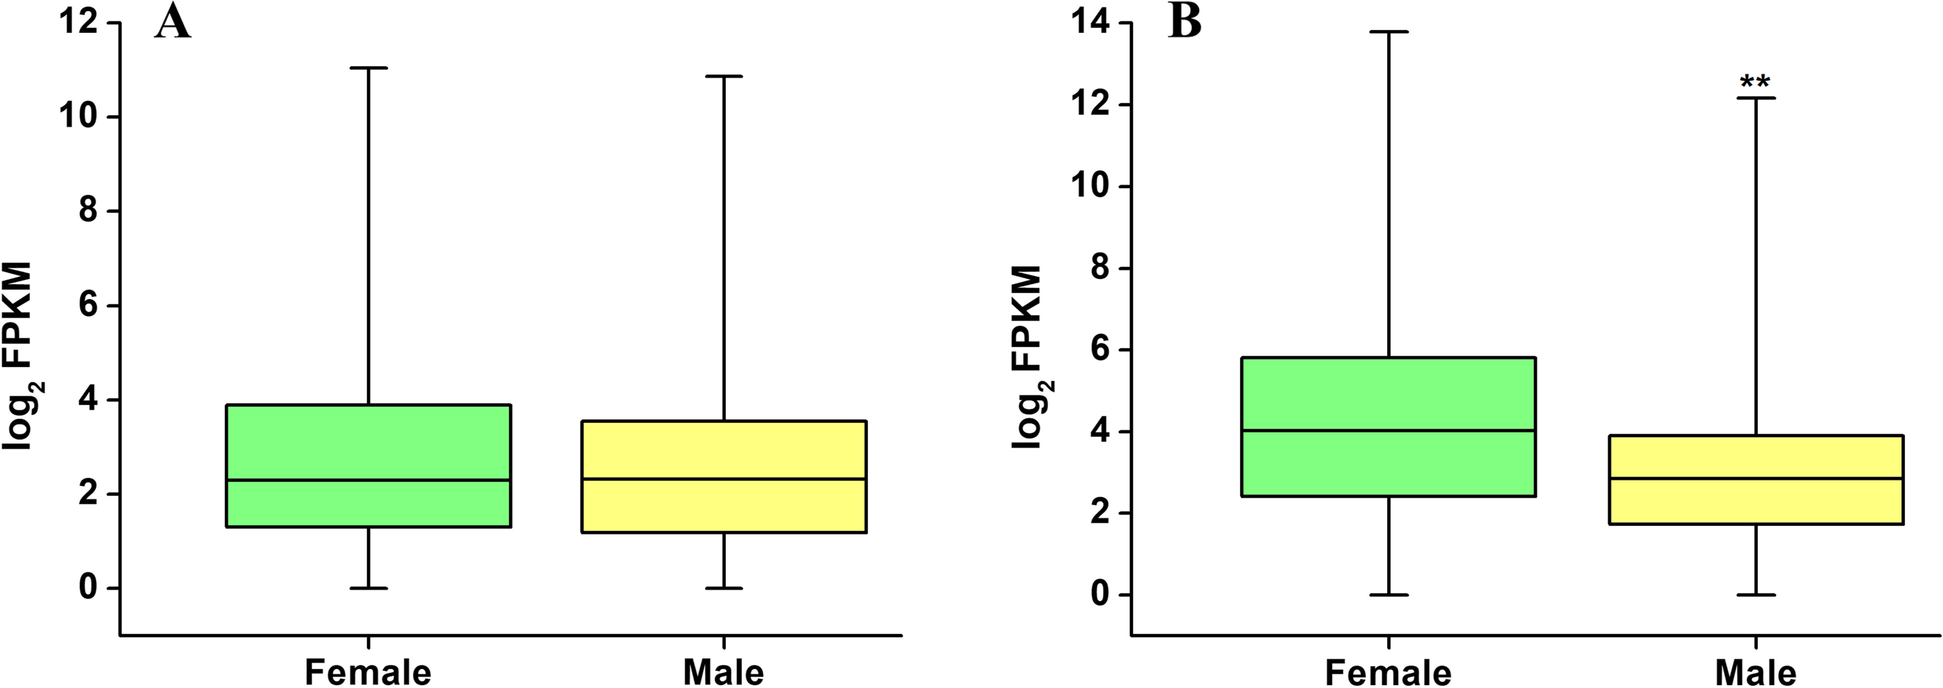
Boxplot showing the mean expression levels (FPKM) of female- and male-biased genes for immature (A) and mature (B) gametophytes. Asterisks indicate a significant difference (Mann–Whitney U test,p < 0.05)

Boxplot showing the mean expression levels (FPKM) of female- and male-biased genes for immature (A) and mature (B) gametophytes. Asterisks indicate a significant difference (Mann–Whitney U test,p < 0.05)